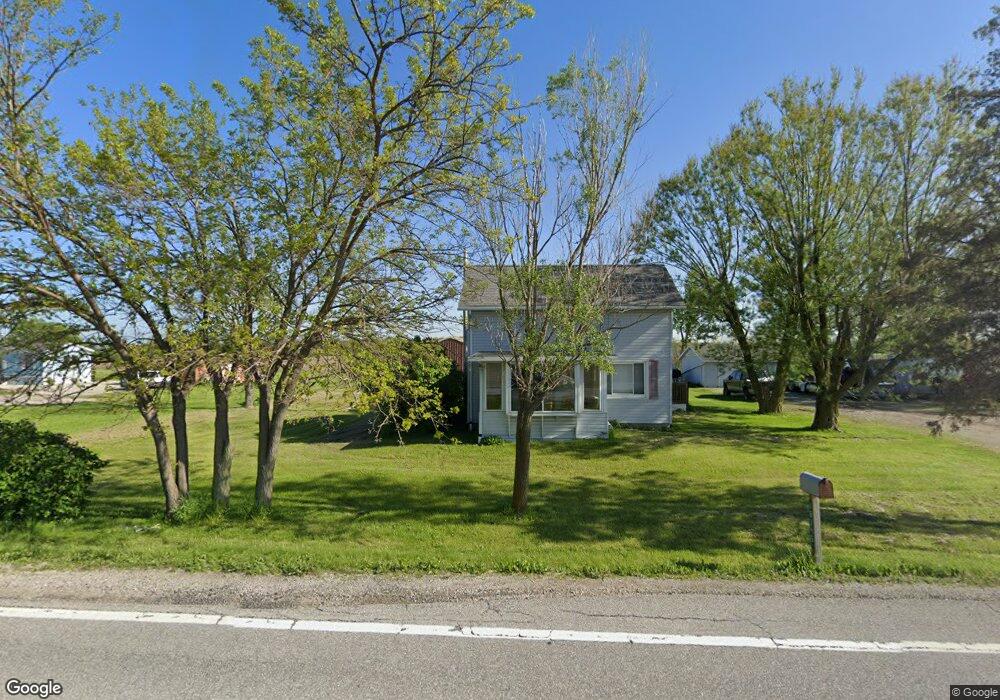
18345 State Route 111 Paulding, OH 45879
Estimated Value: $123,109 - $175,000
3
Beds
1
Bath
1,137
Sq Ft
$137/Sq Ft
Est. Value
About This Home
This home is located at 18345 State Route 111, Paulding, OH 45879 and is currently estimated at $155,527, approximately $136 per square foot. 18345 State Route 111 is a home located in Paulding County with nearby schools including Paulding High School.
Ownership History
Date
Name
Owned For
Owner Type
Purchase Details
Closed on
May 19, 2011
Sold by
Theis Terence L
Bought by
Dickison Francis E
Current Estimated Value
Home Financials for this Owner
Home Financials are based on the most recent Mortgage that was taken out on this home.
Original Mortgage
$97,800
Interest Rate
4.86%
Mortgage Type
Purchase Money Mortgage
Purchase Details
Closed on
Apr 29, 2011
Sold by
Dickson Francis E
Bought by
Theis Terence L
Home Financials for this Owner
Home Financials are based on the most recent Mortgage that was taken out on this home.
Original Mortgage
$97,800
Interest Rate
4.86%
Mortgage Type
Purchase Money Mortgage
Purchase Details
Closed on
Jan 28, 2011
Sold by
Dickison Francis E
Bought by
Theis Terence L
Purchase Details
Closed on
Dec 20, 2007
Sold by
Theis Donna J
Bought by
Theis Terence L
Purchase Details
Closed on
Sep 14, 2006
Sold by
Theis Donna J
Bought by
Theis Donna J and Theis Terence L
Purchase Details
Closed on
Jul 10, 1996
Bought by
Dickison Francis E
Create a Home Valuation Report for This Property
The Home Valuation Report is an in-depth analysis detailing your home's value as well as a comparison with similar homes in the area
Purchase History
| Date | Buyer | Sale Price | Title Company |
|---|---|---|---|
| Dickison Francis E | -- | None Available | |
| Theis Terence L | -- | None Available | |
| Dickson Francis E | $97,800 | None Available | |
| Theis Terence L | -- | -- | |
| Theis Terence L | -- | None Available | |
| Theis Donna J | -- | None Available | |
| Dickison Francis E | $600 | -- |
Source: Public Records
Mortgage History
| Date | Status | Borrower | Loan Amount |
|---|---|---|---|
| Previous Owner | Dickson Francis E | $97,800 |
Source: Public Records
Tax History
| Year | Tax Paid | Tax Assessment Tax Assessment Total Assessment is a certain percentage of the fair market value that is determined by local assessors to be the total taxable value of land and additions on the property. | Land | Improvement |
|---|---|---|---|---|
| 2025 | $1,603 | $46,550 | $9,660 | $36,890 |
| 2024 | $1,603 | $33,260 | $6,900 | $26,360 |
| 2023 | $1,193 | $33,260 | $6,900 | $26,360 |
| 2022 | $1,187 | $33,260 | $6,900 | $26,360 |
| 2021 | $1,116 | $28,880 | $6,720 | $22,160 |
| 2020 | $1,165 | $28,880 | $6,720 | $22,160 |
| 2019 | $1,176 | $27,830 | $6,720 | $21,110 |
| 2018 | $1,139 | $27,830 | $6,720 | $21,110 |
| 2017 | $1,141 | $27,830 | $6,720 | $21,110 |
| 2016 | $1,141 | $27,830 | $6,720 | $21,110 |
| 2015 | $1,114 | $27,480 | $6,650 | $20,830 |
| 2014 | $1,108 | $27,480 | $6,650 | $20,830 |
| 2013 | $1,186 | $27,480 | $6,650 | $20,830 |
Source: Public Records
Map
Nearby Homes
- 14817 Road 171
- 14364 Road 171
- 18740 County Road 218
- 17341 Road 139
- 21355 Ohio 637
- 14309 Singer Rd
- 22585 Defiance-Paulding County Line Rd
- 10955 Road 171
- 0 Powers Rd Unit 10004676
- 13688 Kay St
- 23987 S State Route 66
- 15010 U S 127
- 14424 Karnes Rd
- 24220 County Road 196
- 1065 Emerald Rd
- 741 Tom Tim Dr
- 1582 S Clinton St
- 780 N Williams St
- 726 N Main St
- 830 N Walnut St
- 18345 State Route 111
- 18262 State Route 111
- 18259 State Route 111
- 18483 State Route 111
- 11 County Road 111
- 15255 County Road 149
- 15206 County Road 149
- 18633 County Road 111
- 15261 Road 143
- 15289 County Road 149
- 15287 Road 143
- 15323 County Road 149
- 18692 State Route 111
- 18692 State Route 111
- 18692 Ohio 111
- 15385 Road 149
- 15351 Road 143
- 14618 State Route 637
- 18561 County Road 111
- 18922 County Road 1005
Your Personal Tour Guide
Ask me questions while you tour the home.