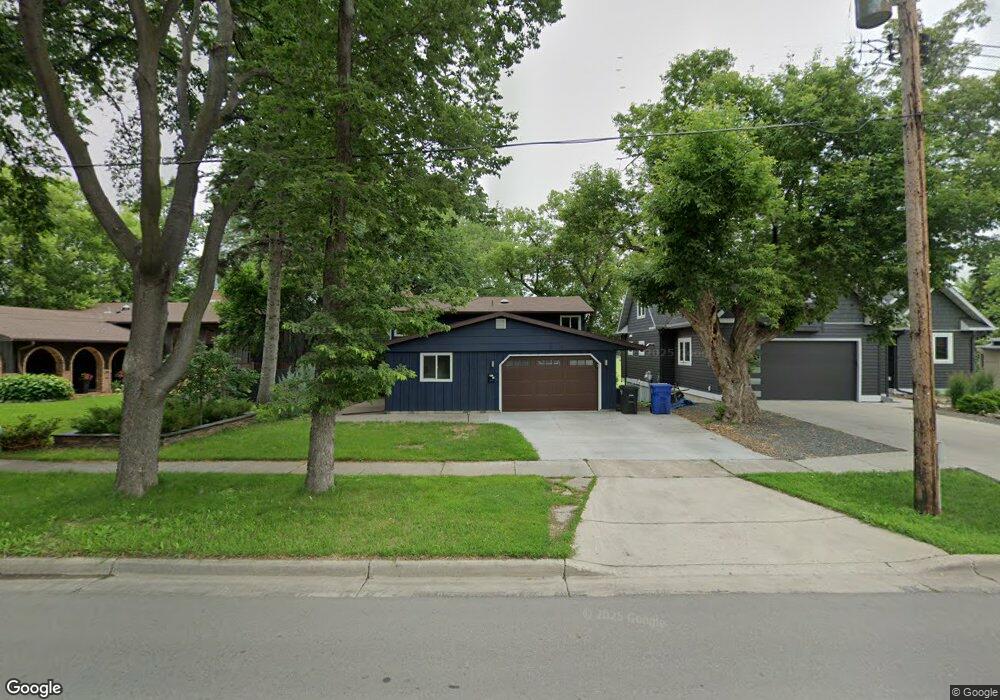
1835 3rd St N Fargo, ND 58102
Washington NeighborhoodEstimated Value: $271,000 - $358,133
4
Beds
2
Baths
1,969
Sq Ft
$157/Sq Ft
Est. Value
About This Home
This home is located at 1835 3rd St N, Fargo, ND 58102 and is currently estimated at $309,283, approximately $157 per square foot. 1835 3rd St N is a home located in Cass County with nearby schools including Washington Elementary School, Ben Franklin Middle School, and North High School.
Ownership History
Date
Name
Owned For
Owner Type
Purchase Details
Closed on
Feb 14, 2025
Sold by
Providence Homes Llc
Bought by
Forster Scott
Current Estimated Value
Home Financials for this Owner
Home Financials are based on the most recent Mortgage that was taken out on this home.
Original Mortgage
$141,300
Outstanding Balance
$137,884
Interest Rate
6.13%
Mortgage Type
New Conventional
Estimated Equity
$171,399
Purchase Details
Closed on
Jun 17, 2024
Sold by
Vane David J
Bought by
Providence Homes Llc
Home Financials for this Owner
Home Financials are based on the most recent Mortgage that was taken out on this home.
Original Mortgage
$256,365
Interest Rate
7.22%
Mortgage Type
Construction
Purchase Details
Closed on
Nov 29, 2019
Sold by
Vane Verla J
Bought by
Vane David J
Purchase Details
Closed on
Jun 15, 2005
Sold by
Farmer Robert and Kirk Patrick
Bought by
Vane David J and Vane Verla J
Home Financials for this Owner
Home Financials are based on the most recent Mortgage that was taken out on this home.
Original Mortgage
$145,800
Interest Rate
5.12%
Mortgage Type
FHA
Create a Home Valuation Report for This Property
The Home Valuation Report is an in-depth analysis detailing your home's value as well as a comparison with similar homes in the area
Home Values in the Area
Average Home Value in this Area
Purchase History
| Date | Buyer | Sale Price | Title Company |
|---|---|---|---|
| Forster Scott | $359,000 | The Title Company | |
| Providence Homes Llc | $207,000 | Title Company-Residential | |
| Vane David J | -- | Title Co | |
| Vane David J | -- | -- |
Source: Public Records
Mortgage History
| Date | Status | Borrower | Loan Amount |
|---|---|---|---|
| Open | Forster Scott | $141,300 | |
| Previous Owner | Providence Homes Llc | $256,365 | |
| Previous Owner | Vane David J | $145,800 |
Source: Public Records
Tax History Compared to Growth
Tax History
| Year | Tax Paid | Tax Assessment Tax Assessment Total Assessment is a certain percentage of the fair market value that is determined by local assessors to be the total taxable value of land and additions on the property. | Land | Improvement |
|---|---|---|---|---|
| 2024 | $3,186 | $118,550 | $27,000 | $91,550 |
| 2023 | $2,881 | $107,750 | $27,000 | $80,750 |
| 2022 | $2,737 | $100,700 | $27,000 | $73,700 |
| 2021 | $2,531 | $95,000 | $27,000 | $68,000 |
| 2020 | $2,498 | $95,000 | $27,000 | $68,000 |
| 2019 | $2,500 | $95,000 | $15,000 | $80,000 |
| 2018 | $2,805 | $108,000 | $15,000 | $93,000 |
| 2017 | $2,594 | $100,950 | $15,000 | $85,950 |
| 2016 | $2,223 | $94,350 | $15,000 | $79,350 |
| 2015 | $2,155 | $85,750 | $11,250 | $74,500 |
| 2014 | $2,267 | $87,950 | $11,250 | $76,700 |
| 2013 | $2,121 | $82,200 | $11,250 | $70,950 |
Source: Public Records
Map
Nearby Homes
- 1822 3rd St N
- 314 18th Ave N
- 305 19th Ave N
- 111 19th Ave N
- 1633 3rd St N
- 3216 Broadway N
- 1645 Broadway N
- 207 23rd Ave N
- 1626 Broadway N
- 418 25th Ave N
- 1914 9th St N
- 2512 2nd St N
- 310 27th Ave N
- 1610 9th St N
- 1437 Broadway N Unit 102
- 2510 Evergreen Rd N
- 2214 9 1 2 St N
- 101 27th Ave N
- 1625 11th St N
- 1538 10th St N