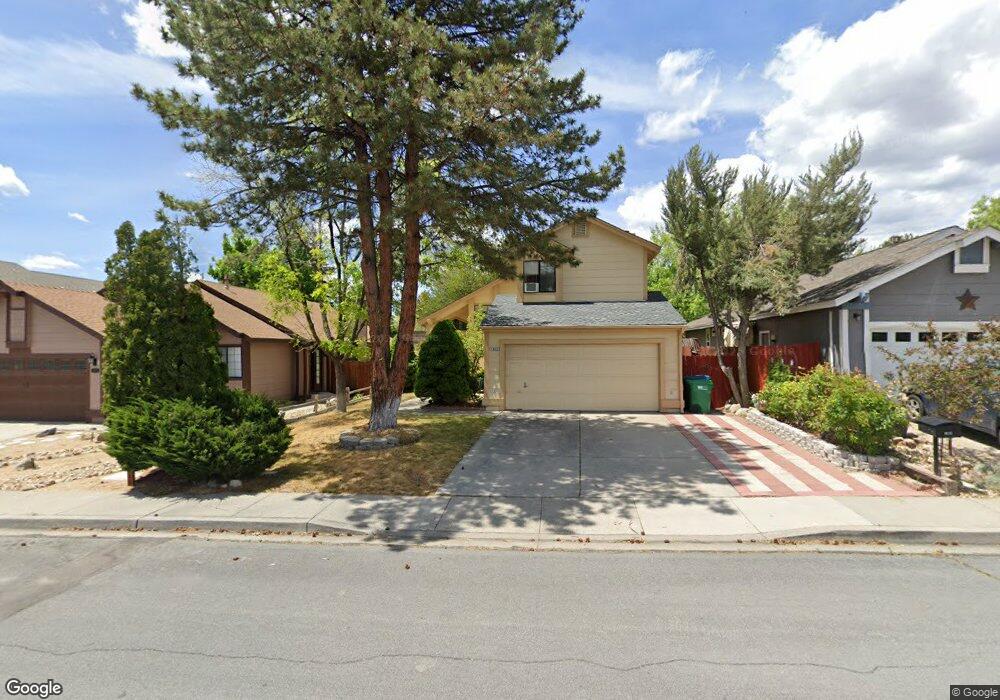
1835 Amarak Way Reno, NV 89523
Mae Anne Avenue NeighborhoodEstimated Value: $494,000 - $524,000
3
Beds
3
Baths
1,552
Sq Ft
$329/Sq Ft
Est. Value
About This Home
This home is located at 1835 Amarak Way, Reno, NV 89523 and is currently estimated at $509,906, approximately $328 per square foot. 1835 Amarak Way is a home located in Washoe County with nearby schools including Sarah Winnemucca Elementary School, B D Billinghurst Middle School, and Robert McQueen High School.
Ownership History
Date
Name
Owned For
Owner Type
Purchase Details
Closed on
Dec 6, 1999
Sold by
Harrison David C and Harrison Jacqueline K
Bought by
Sarwar Mohammed H and Sarwar Momtaz
Current Estimated Value
Home Financials for this Owner
Home Financials are based on the most recent Mortgage that was taken out on this home.
Original Mortgage
$146,984
Outstanding Balance
$45,423
Interest Rate
7.69%
Mortgage Type
FHA
Estimated Equity
$464,483
Purchase Details
Closed on
Feb 25, 1994
Sold by
Enrico Andre J and Enrico Peggy A
Bought by
Harrison David C and Harrison Jacqueline K
Home Financials for this Owner
Home Financials are based on the most recent Mortgage that was taken out on this home.
Original Mortgage
$142,598
Interest Rate
6.98%
Mortgage Type
VA
Create a Home Valuation Report for This Property
The Home Valuation Report is an in-depth analysis detailing your home's value as well as a comparison with similar homes in the area
Home Values in the Area
Average Home Value in this Area
Purchase History
| Date | Buyer | Sale Price | Title Company |
|---|---|---|---|
| Sarwar Mohammed H | $148,000 | Stewart Title Company | |
| Harrison David C | $140,000 | Western Title Company Inc |
Source: Public Records
Mortgage History
| Date | Status | Borrower | Loan Amount |
|---|---|---|---|
| Open | Sarwar Mohammed H | $146,984 | |
| Previous Owner | Harrison David C | $142,598 |
Source: Public Records
Tax History Compared to Growth
Tax History
| Year | Tax Paid | Tax Assessment Tax Assessment Total Assessment is a certain percentage of the fair market value that is determined by local assessors to be the total taxable value of land and additions on the property. | Land | Improvement |
|---|---|---|---|---|
| 2025 | $2,027 | $77,897 | $35,406 | $42,491 |
| 2024 | $2,027 | $75,372 | $32,036 | $43,337 |
| 2023 | $1,969 | $75,191 | $33,768 | $41,423 |
| 2022 | $1,915 | $63,190 | $28,445 | $34,746 |
| 2021 | $1,860 | $54,470 | $19,562 | $34,908 |
| 2020 | $1,803 | $54,083 | $18,806 | $35,277 |
| 2019 | $1,753 | $53,017 | $18,680 | $34,337 |
| 2018 | $1,698 | $47,500 | $13,577 | $33,923 |
| 2017 | $1,649 | $46,874 | $12,663 | $34,211 |
| 2016 | $1,607 | $46,518 | $11,403 | $35,115 |
| 2015 | $1,605 | $45,314 | $9,986 | $35,328 |
| 2014 | $1,558 | $43,598 | $8,978 | $34,620 |
| 2013 | -- | $41,162 | $6,883 | $34,279 |
Source: Public Records
Map
Nearby Homes
- 1770 Amarak Way
- 1931 E Minaret Cir
- 6220 Valley Wood Dr
- 1626 Icelandic Way
- 1618 Icelandic Way Unit Lot 67
- 1618 Icelandic Way
- 1639 Prancer St Unit Lot 47
- Walker Plan at Monarch
- Humboldt Plan at Monarch
- 5878 Grand Row Way
- 5849 Morgan Horse St
- 5882 Grand Row Way Unit Lot 61
- 1615 Prancer St Unit Lot 53
- 1627 Prancer St Unit Lot 50
- 1627 Prancer St
- 5721 Royal Vista Way
- 1689 Shadow Park Dr
- 1915 Celestial Ct
- 1659 Shadow Park Dr
- 5895 Blue Horizon Dr
- 1845 Amarak Way
- 1825 Amarak Way
- 1855 Amarak Way
- 1815 Amarak Way
- 1805 Amarak Way
- 1865 Amarak Way
- 5994 Shadow Park Dr
- 1894 E Minaret Cir Unit 1
- 1810 Amarak Way
- 1795 Amarak Way
- 5995 Shadow Park Dr
- 5984 Shadow Park Dr
- 1875 Amarak Way
- 1890 E Minaret Cir
- 1896 E Minaret Cir
- 1800 Amarak Way
- 5985 Shadow Park Dr
- 1785 Amarak Way
- 1888 E Minaret Cir Unit 1
- 1898 E Minaret Cir