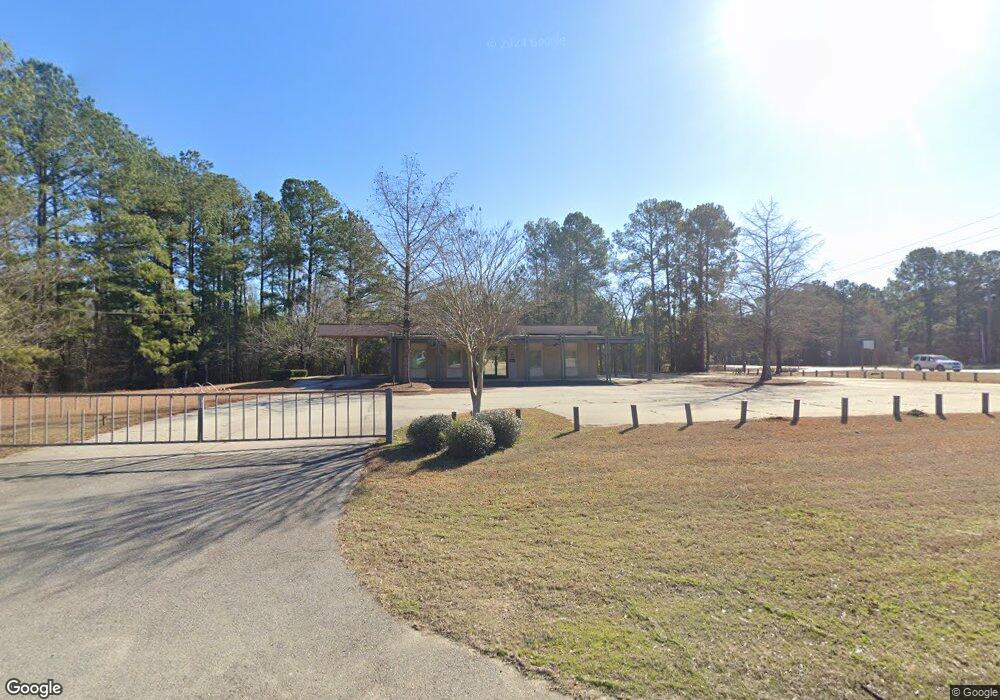
1835 Appling Harlem Rd Appling, GA 30802
Estimated Value: $775,662
Studio
2
Baths
1,900
Sq Ft
$408/Sq Ft
Est. Value
About This Home
This home is located at 1835 Appling Harlem Rd, Appling, GA 30802 and is currently estimated at $775,662, approximately $408 per square foot. 1835 Appling Harlem Rd is a home located in Columbia County with nearby schools including North Columbia Elementary School, Harlem Middle School, and Harlem High School.
Ownership History
Date
Name
Owned For
Owner Type
Purchase Details
Closed on
Oct 14, 2025
Sold by
Kane Real Estate Investments
Bought by
B & L Investor Group Llc
Current Estimated Value
Purchase Details
Closed on
Apr 25, 2006
Sold by
Regions Bank
Bought by
Kane Re Invst Llc
Create a Home Valuation Report for This Property
The Home Valuation Report is an in-depth analysis detailing your home's value as well as a comparison with similar homes in the area
Purchase History
| Date | Buyer | Sale Price | Title Company |
|---|---|---|---|
| B & L Investor Group Llc | $775,000 | -- | |
| Kane Re Invst Llc | $140,000 | -- |
Source: Public Records
Tax History
| Year | Tax Paid | Tax Assessment Tax Assessment Total Assessment is a certain percentage of the fair market value that is determined by local assessors to be the total taxable value of land and additions on the property. | Land | Improvement |
|---|---|---|---|---|
| 2025 | $5,804 | $243,495 | $165,240 | $78,255 |
| 2024 | $6,106 | $244,516 | $165,240 | $79,276 |
| 2023 | $6,106 | $200,818 | $118,676 | $82,142 |
| 2022 | $4,842 | $186,469 | $110,799 | $75,670 |
| 2021 | $4,113 | $151,381 | $79,755 | $71,626 |
| 2020 | $4,269 | $153,854 | $79,755 | $74,099 |
| 2019 | $2,935 | $105,779 | $50,264 | $55,515 |
| 2018 | $3,097 | $111,256 | $50,264 | $60,992 |
| 2017 | $3,030 | $108,462 | $50,264 | $58,198 |
| 2016 | $2,855 | $105,998 | $49,225 | $56,773 |
| 2015 | $2,613 | $96,819 | $38,618 | $58,201 |
| 2014 | $2,716 | $99,403 | $38,618 | $60,785 |
Source: Public Records
Map
Nearby Homes
- 6658 Shucraft Rd
- 435 Abundance Way
- 6197 Columbia Rd
- 3256 Ray Owens Rd
- 101 Crystal Creek Ln
- 127 Crystal Creek Ln
- 2526 Scotts Ferry Rd
- 350 Annie Laurie Dr
- 6662 Shucraft Rd
- 612 McZilkey Dr
- 582 McZilkey Dr
- 5660 White Oak Rd
- 5672 White Oak Rd
- 2369 Pine Ridge Rd
- 2362 Pine Ridge Rd
- 1229 Yost Dr
- 307 Alabaster Ct
- 0 Dozier Rd
- 1171 Meandering Trail
- 0 Louisville Rd Unit 553370
- 6415 Columbia Rd
- 1825 Appling Harlem Rd
- 6409 Columbia Rd
- 6407 Columbia Rd
- 1844 Appling Harlem Rd
- 6399 Columbia Rd
- 1813 Appling Harlem Rd
- 1832 Appling Harlem Rd
- 6395 Columbia Rd
- 1805 Appling Harlem Rd
- 1810 Appling Harlem Rd
- 1803 Appling Harlem Rd
- 6386 Columbia Rd
- 1868 Appling Harlem Rd
- 6383 Columbia Rd
- 1876 Appling Harlem Rd
- 1808 Appling Harlem Rd
- 1858 Appling Harlem Rd
- 1790 Appling Harlem Rd
- 6374 Columbia Rd
Your Personal Tour Guide
Ask me questions while you tour the home.