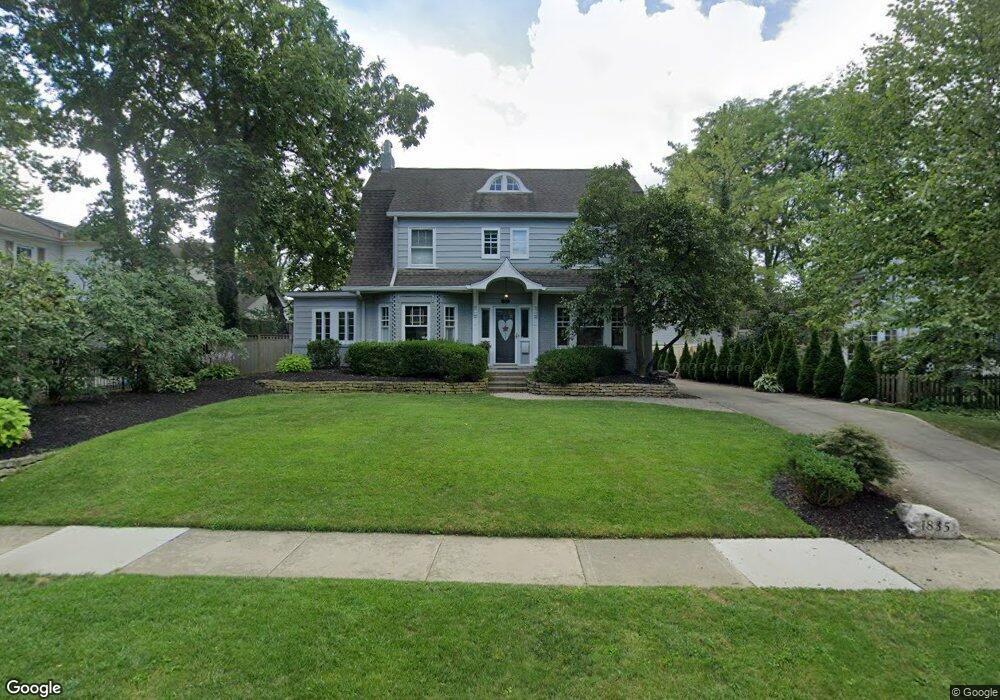
1835 Edgemont Rd Columbus, OH 43212
Estimated Value: $1,030,000 - $1,144,000
4
Beds
3
Baths
2,982
Sq Ft
$361/Sq Ft
Est. Value
About This Home
This home is located at 1835 Edgemont Rd, Columbus, OH 43212 and is currently estimated at $1,076,676, approximately $361 per square foot. 1835 Edgemont Rd is a home located in Franklin County with nearby schools including Barrington Road Elementary School, Jones Middle School, and Upper Arlington High School.
Ownership History
Date
Name
Owned For
Owner Type
Purchase Details
Closed on
Jan 16, 2007
Sold by
Caldwell David M and Caldwell Nicole V
Bought by
Benson William E and Church Melinda D
Current Estimated Value
Home Financials for this Owner
Home Financials are based on the most recent Mortgage that was taken out on this home.
Original Mortgage
$285,000
Interest Rate
6.21%
Mortgage Type
Purchase Money Mortgage
Purchase Details
Closed on
Feb 27, 2002
Sold by
Snider Lawrence E and Snider Margaret M
Bought by
Caldwell David M and Caldwell Nicole V
Home Financials for this Owner
Home Financials are based on the most recent Mortgage that was taken out on this home.
Original Mortgage
$37,325
Interest Rate
6.92%
Purchase Details
Closed on
Jul 2, 1984
Bought by
Snider Lawrence E
Create a Home Valuation Report for This Property
The Home Valuation Report is an in-depth analysis detailing your home's value as well as a comparison with similar homes in the area
Home Values in the Area
Average Home Value in this Area
Purchase History
| Date | Buyer | Sale Price | Title Company |
|---|---|---|---|
| Benson William E | $490,000 | Attorney | |
| Caldwell David M | $386,500 | Midland Celtic Title | |
| Snider Lawrence E | $89,000 | -- |
Source: Public Records
Mortgage History
| Date | Status | Borrower | Loan Amount |
|---|---|---|---|
| Closed | Benson William E | $285,000 | |
| Closed | Caldwell David M | $37,325 |
Source: Public Records
Tax History
| Year | Tax Paid | Tax Assessment Tax Assessment Total Assessment is a certain percentage of the fair market value that is determined by local assessors to be the total taxable value of land and additions on the property. | Land | Improvement |
|---|---|---|---|---|
| 2025 | $16,642 | $287,460 | $123,410 | $164,050 |
| 2024 | $16,642 | $287,460 | $123,410 | $164,050 |
| 2023 | $16,436 | $287,455 | $123,410 | $164,045 |
| 2022 | $14,892 | $213,120 | $74,620 | $138,500 |
| 2021 | $13,183 | $213,120 | $74,620 | $138,500 |
| 2020 | $13,066 | $213,120 | $74,620 | $138,500 |
| 2019 | $13,150 | $189,630 | $74,620 | $115,010 |
| 2018 | $12,852 | $189,630 | $74,620 | $115,010 |
| 2017 | $12,844 | $189,630 | $74,620 | $115,010 |
| 2016 | $12,640 | $191,170 | $55,020 | $136,150 |
| 2015 | $12,629 | $191,170 | $55,020 | $136,150 |
| 2014 | $12,643 | $191,170 | $55,020 | $136,150 |
| 2013 | $6,037 | $173,775 | $50,015 | $123,760 |
Source: Public Records
Map
Nearby Homes
- 1942 Bedford Rd
- 1780 Waltham Rd
- 1921 Wyandotte Rd
- 1951 Glenn Ave
- 1876 Westwood Ave
- 2006 Cambridge Blvd
- 2151 Fairfax Rd
- 2208 Arlington Ave
- 1810 Ashland Ave
- 1869 Tewksbury Rd
- 1627 Doone Rd
- 2036 Beverly Rd
- 1785 Northwest Ct Unit D
- 1876 Northwest Blvd Unit 2B
- 1960 Hillside Dr
- 1654-1656 Ashland Ave
- 1775 Northwest Ct Unit 105
- 1648 Ashland Ave
- 2015 W 5th Ave Unit 211
- 2015 W 5th Ave Unit 102
- 1981 Bedford Rd
- 1976 Coventry Rd
- 1956 Coventry Rd
- 1961 Bedford Rd
- 1838 Edgemont Rd
- 1826 Edgemont Rd
- 2006 Coventry Rd
- 1952 Coventry Rd
- 1974 Bedford Rd
- 1983 Coventry Rd
- 1977 Coventry Rd
- 1806 Edgemont Rd
- 1957 Coventry Rd
- 1964 Bedford Rd
- 2021 Bedford Rd
- 1943 Bedford Rd
- 1940 Coventry Rd
- 2018 Coventry Rd
- 1955 Coventry Rd
- 1960 Bedford Rd
Your Personal Tour Guide
Ask me questions while you tour the home.