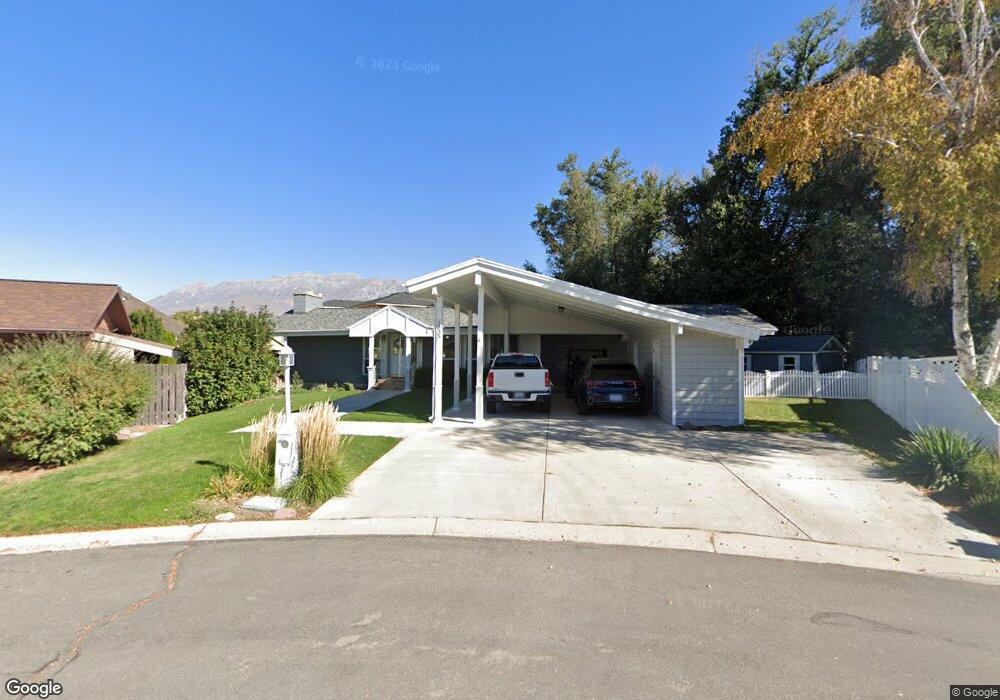
1835 Park Ln E Orem, UT 84058
Cherry Hill NeighborhoodEstimated Value: $483,003 - $542,000
3
Beds
2
Baths
1,320
Sq Ft
$394/Sq Ft
Est. Value
About This Home
This home is located at 1835 Park Ln E, Orem, UT 84058 and is currently estimated at $520,334, approximately $394 per square foot. 1835 Park Ln E is a home located in Utah County with nearby schools including Cherry Hill Elementary School, Lakeridge Jr High School, and Mountain View High School.
Ownership History
Date
Name
Owned For
Owner Type
Purchase Details
Closed on
Apr 19, 2019
Sold by
Roberts Richard and Roberts Patricia
Bought by
Richard Roberts Family Revocable Trust
Current Estimated Value
Purchase Details
Closed on
Dec 21, 2004
Sold by
Taylor Dale M and D & A Taylor Gift One Trust
Bought by
Roberts Richard and Roberts Patricia
Home Financials for this Owner
Home Financials are based on the most recent Mortgage that was taken out on this home.
Original Mortgage
$117,223
Interest Rate
5.7%
Mortgage Type
Seller Take Back
Create a Home Valuation Report for This Property
The Home Valuation Report is an in-depth analysis detailing your home's value as well as a comparison with similar homes in the area
Home Values in the Area
Average Home Value in this Area
Purchase History
| Date | Buyer | Sale Price | Title Company |
|---|---|---|---|
| Richard Roberts Family Revocable Trust | -- | Provo Land Title Co | |
| Roberts Richard | -- | Provo Land Title Company | |
| Taylor Dale M | -- | Provo Land Title Company |
Source: Public Records
Mortgage History
| Date | Status | Borrower | Loan Amount |
|---|---|---|---|
| Previous Owner | Roberts Richard | $117,223 |
Source: Public Records
Tax History
| Year | Tax Paid | Tax Assessment Tax Assessment Total Assessment is a certain percentage of the fair market value that is determined by local assessors to be the total taxable value of land and additions on the property. | Land | Improvement |
|---|---|---|---|---|
| 2025 | $2,095 | $259,710 | -- | -- |
| 2024 | $2,095 | $256,135 | $0 | $0 |
| 2023 | $1,947 | $255,915 | $0 | $0 |
| 2022 | $1,934 | $246,180 | $0 | $0 |
| 2021 | $1,753 | $338,100 | $133,000 | $205,100 |
| 2020 | $1,612 | $305,500 | $106,400 | $199,100 |
| 2019 | $1,415 | $278,900 | $92,200 | $186,700 |
| 2018 | $1,418 | $267,000 | $88,700 | $178,300 |
| 2017 | $1,291 | $130,240 | $0 | $0 |
| 2016 | $1,364 | $126,885 | $0 | $0 |
| 2015 | $1,344 | $118,250 | $0 | $0 |
| 2014 | $1,326 | $116,160 | $0 | $0 |
Source: Public Records
Map
Nearby Homes
Your Personal Tour Guide
Ask me questions while you tour the home.