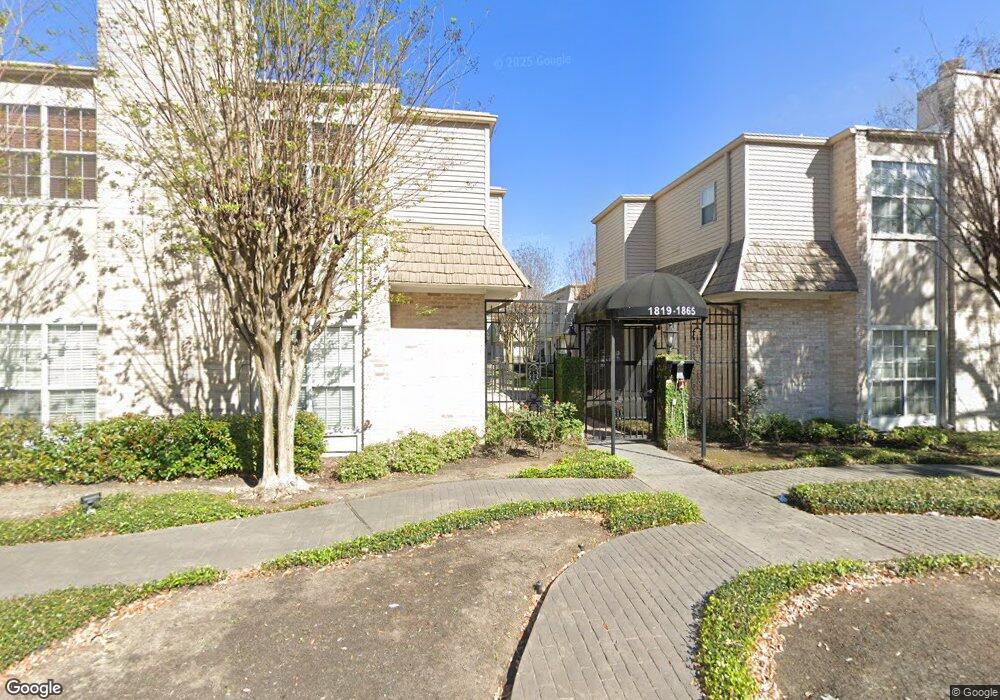
1835 Post Oak Park Dr Unit 1835 Houston, TX 77027
River Oaks NeighborhoodEstimated Value: $390,000 - $405,235
2
Beds
3
Baths
2,353
Sq Ft
$169/Sq Ft
Est. Value
About This Home
This home is located at 1835 Post Oak Park Dr Unit 1835, Houston, TX 77027 and is currently estimated at $397,309, approximately $168 per square foot. 1835 Post Oak Park Dr Unit 1835 is a home located in Harris County with nearby schools including School at St. George Place, Lanier Middle School, and Lamar High School.
Ownership History
Date
Name
Owned For
Owner Type
Purchase Details
Closed on
Sep 30, 2021
Sold by
Huang Edmund T
Bought by
Sobhani Sina and Sobhani Martha
Current Estimated Value
Home Financials for this Owner
Home Financials are based on the most recent Mortgage that was taken out on this home.
Original Mortgage
$230,000
Outstanding Balance
$52,598
Interest Rate
2.8%
Mortgage Type
Purchase Money Mortgage
Estimated Equity
$344,711
Purchase Details
Closed on
Aug 1, 2013
Sold by
Weaver Staci L and Good Kevin
Bought by
Huang Edmud T
Purchase Details
Closed on
Jun 18, 2007
Sold by
Carrillo Roberta E
Bought by
Weaver Staci L
Home Financials for this Owner
Home Financials are based on the most recent Mortgage that was taken out on this home.
Original Mortgage
$40,000
Interest Rate
6.16%
Mortgage Type
Negative Amortization
Purchase Details
Closed on
Jun 29, 2006
Sold by
Krueger Marlena
Bought by
Carrillo Roberta A
Home Financials for this Owner
Home Financials are based on the most recent Mortgage that was taken out on this home.
Original Mortgage
$147,340
Interest Rate
6.63%
Mortgage Type
Purchase Money Mortgage
Create a Home Valuation Report for This Property
The Home Valuation Report is an in-depth analysis detailing your home's value as well as a comparison with similar homes in the area
Home Values in the Area
Average Home Value in this Area
Purchase History
| Date | Buyer | Sale Price | Title Company |
|---|---|---|---|
| Sobhani Sina | -- | Chicago Title | |
| Huang Edmud T | -- | Charter Title Co | |
| Weaver Staci L | -- | First American Title | |
| Carrillo Roberta A | -- | Ameripoint Title |
Source: Public Records
Mortgage History
| Date | Status | Borrower | Loan Amount |
|---|---|---|---|
| Open | Sobhani Sina | $230,000 | |
| Previous Owner | Weaver Staci L | $40,000 | |
| Previous Owner | Carrillo Roberta A | $147,340 |
Source: Public Records
Tax History Compared to Growth
Tax History
| Year | Tax Paid | Tax Assessment Tax Assessment Total Assessment is a certain percentage of the fair market value that is determined by local assessors to be the total taxable value of land and additions on the property. | Land | Improvement |
|---|---|---|---|---|
| 2025 | $6,884 | $329,000 | $62,510 | $266,490 |
| 2024 | $6,884 | $329,000 | $62,510 | $266,490 |
| 2023 | $6,884 | $350,619 | $66,618 | $284,001 |
| 2022 | $7,685 | $349,000 | $75,050 | $273,950 |
| 2021 | $8,134 | $349,000 | $75,050 | $273,950 |
| 2020 | $10,741 | $443,555 | $84,275 | $359,280 |
| 2019 | $10,122 | $400,000 | $93,000 | $307,000 |
| 2018 | $11,498 | $454,400 | $86,336 | $368,064 |
| 2017 | $8,850 | $350,000 | $66,500 | $283,500 |
| 2016 | $8,806 | $348,263 | $66,170 | $282,093 |
| 2015 | $6,549 | $316,239 | $60,085 | $256,154 |
| 2014 | $6,549 | $254,760 | $48,404 | $206,356 |
Source: Public Records
Map
Nearby Homes
- 4515 Briar Hollow Place Unit 307
- 21 Briar Hollow Ln Unit 408
- 16 Stalynn Ln
- 20 Audubon Hollow Ln
- 28 Audubon Hollow Ln
- 20 Eaton Square
- 56 Audubon Hollow Ln
- 7 N Raintree Hollow Ln
- 49 Briar Hollow Ln Unit 406
- 49 Briar Hollow Ln Unit 302
- 49 Briar Hollow Ln Unit 605
- 49 Briar Hollow Ln Unit 206
- 49 Briar Hollow Ln Unit 702
- 49 Briar Hollow Ln Unit 1801
- 49 Briar Hollow Ln Unit 1201
- 10 S Briar Hollow Ln Unit 87
- 10 S Briar Hollow Ln Unit 15
- 4 River Hollow Ln
- 6 Briar Dale Ct
- 2 S Briar Hollow Ln Unit 2
- 1861 Post Oak Blvd Unit 1861
- 1833 Post Oak Park Dr Unit 1833
- 1829 Post Oak Park Dr Unit 1829
- 1861 Post Oak Park Dr Unit 1861
- 1835 Post Oak Park Dr
- 1831 Post Oak Park Dr Unit 1831
- 1865 Post Oak Park Dr Unit 1865
- 1863 Post Oak Park Dr Unit 1863
- 1827 Post Oak Park Dr Unit 1827
- 1859 Post Oak Park Dr Unit 1859
- 1825 Post Oak Park Dr Unit 1825
- 1857 Post Oak Park Dr Unit 1857
- 1823 Post Oak Park Dr Unit 1823
- 1855 Post Oak Park Dr Unit 1855
- 1821 Post Oak Park Dr Unit 1821
- 1853 Post Oak Park Dr Unit 1853
- 1851 Post Oak Park Dr Unit 1851
- 1843 Post Oak Park Dr Unit 1843
- 1819 Post Oak Park Dr Unit 1819
- 1845 Post Oak Park Dr Unit 1845