


1835 S Cherry St Tomball, TX 77375
Estimated payment $8,286/month
Highlights
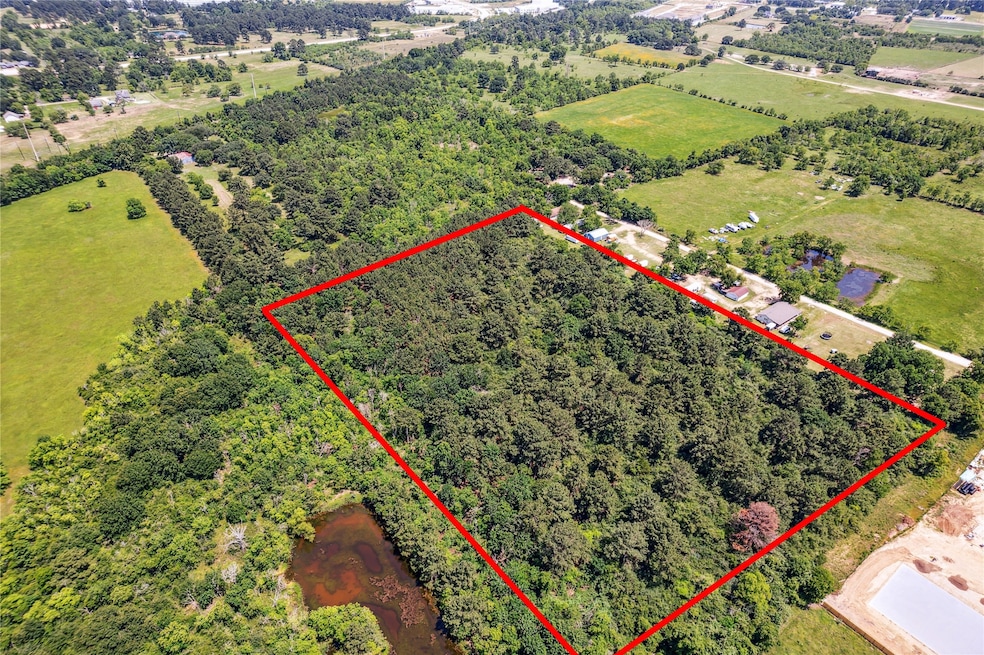
- 10 Acre Lot
- Tomball Intermediate School Rated A
- Wooded Lot
About This Lot
Situated on 9.9 expansive acres, this versatile property at 1835 S. Cherry St North offers endless possibilities for residential, farm and ranch, or commercial use. Boasting a generous per lot size of 435600 sqft, this prime location presents a unique opportunity for your dream investment.
Listing Agent
Better Homes and Gardens Real Estate Gary Greene - Champions License #0487244 Listed on: 03/19/2025

Property Details
Property Type
- Land
Est. Annual Taxes
- $20
Lot Details
- 10 Acre Lot
- Wooded Lot
Schools
- Grand Oaks Elementary School
- Tomball Junior High School
- Tomball High School
Utilities
- Not Connected to Water Source
- Sewer Not Available
Community Details
- Tomball Outlots Subdivision
Listing and Financial Details
- Tax Lot 223 & 225
Map
Home Values in the Area
Average Home Value in this Area
Tax History
| Year | Tax Paid | Tax Assessment Tax Assessment Total Assessment is a certain percentage of the fair market value that is determined by local assessors to be the total taxable value of land and additions on the property. | Land | Improvement |
|---|---|---|---|---|
| 2024 | $20 | $435,600 | $435,600 | -- |
| 2023 | $20 | $435,600 | $435,600 | $0 |
| 2022 | $16 | $435,600 | $435,600 | $0 |
| 2021 | $14 | $435,600 | $435,600 | $0 |
| 2020 | $12 | $436,100 | $435,600 | $500 |
| 2019 | $14 | $436,140 | $435,600 | $540 |
| 2018 | $7 | $436,150 | $435,600 | $550 |
| 2017 | $14 | $436,150 | $435,600 | $550 |
| 2016 | $15 | $436,180 | $435,600 | $580 |
| 2015 | $17 | $109,520 | $108,900 | $620 |
| 2014 | $17 | $109,560 | $108,900 | $660 |
Property History
| Date | Event | Price | Change | Sq Ft Price |
|---|---|---|---|---|
| 03/19/2025 03/19/25 | For Sale | $1,500,000 | -40.0% | -- |
| 03/19/2025 03/19/25 | For Sale | $2,500,000 | -- | -- |
Purchase History
| Date | Type | Sale Price | Title Company |
|---|---|---|---|
| Warranty Deed | -- | -- |
Mortgage History
| Date | Status | Loan Amount | Loan Type |
|---|---|---|---|
| Closed | $72,000 | Credit Line Revolving |
Source: Houston Association of REALTORS®
MLS Number: 50090208
APN: 0352860000223
Disclaimer: Certain information contained herein is derived from information provided by parties other than Homes.com. All information provided is deemed reliable, but is not guaranteed to be accurate and should be independently verified.
![]() Copyright 2025, Houston REALTORS® Information Service, Inc.
Copyright 2025, Houston REALTORS® Information Service, Inc.
The information provided is exclusively for consumers’ personal, non-commercial use, and may not be used for any purpose other than to identify prospective properties consumers may be interested in purchasing.
Information is deemed reliable but not guaranteed.
- 1511 Ashley Ct
- 12511 Blossom Dr
- 1533 S Cherry St
- 1118 Mattinson Rae Ct
- 1103 Mattinson Rae Ct
- 1107 Mattinson Rae Ct
- 2238 Memory Oaks Dr Unit 11
- 139 Hollow Terrace Ct
- 2302 Memory Oaks Dr Unit 11
- 1123 Buffalo Run
- 1114 Mattinson Rae Ct
- 1106 Buffalo Run
- 2323 E Winding Pines Dr
- 2322 E Winding Pines
- 1127 Buffalo Run
- 1119 Buffalo Run
- 1210 Buffalo Run
- 1207 Buffalo Run
- 1211 Buffalo Run
- 2331 Scarlett Pine Bend
- 2211 E Winding Pines Dr
- 111 Hollow Terrace Ct
- 2311 E Winding Pines
- 2234 Memory Oaks Dr
- 2007 Stella Pine Dr
- 2023 Stella Pine Dr
- 1100 S Cherry St
- 1203 Buffalo Run
- 300 Belmont St
- 315 Willowick St
- 11306 Misty Willow Ln
- 21450 Petherton Dr
- 408 Mcphail St
- 500 S Walnut St
- 606 Clayton St
- 28011 Johnson Rd
- 20318 Yosemite Falls Dr
- 920 Lawrence St
- 510 Clarence St
- 215 Blackshear St