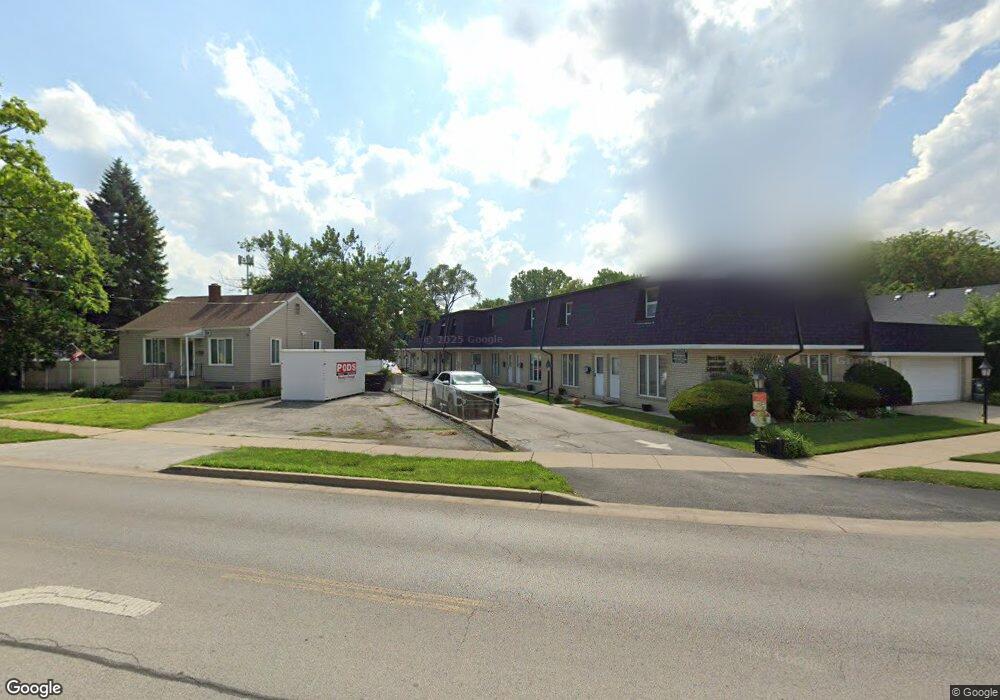
18356 Myrtle Ct Unit 5 Lansing, IL 60438
Estimated Value: $107,874 - $138,000
2
Beds
1
Bath
900
Sq Ft
$134/Sq Ft
Est. Value
About This Home
This home is located at 18356 Myrtle Ct Unit 5, Lansing, IL 60438 and is currently estimated at $120,719, approximately $134 per square foot. 18356 Myrtle Ct Unit 5 is a home located in Cook County with nearby schools including Coolidge Elementary School, Memorial Jr High School, and Thornton Fractnl So High School.
Ownership History
Date
Name
Owned For
Owner Type
Purchase Details
Closed on
Apr 13, 2012
Sold by
Bryant Tytrice
Bought by
Seaway Bank & Trust Company and Trust #200502
Current Estimated Value
Purchase Details
Closed on
Jul 15, 2011
Sold by
Citimortgage Inc
Bought by
Bryant Tytrice L
Purchase Details
Closed on
May 6, 2011
Sold by
Hale Allisa and Hale Alisa J
Bought by
Citimortgage Inc
Purchase Details
Closed on
Aug 31, 2005
Sold by
Lisek Ben Joseph and Lisek Brian Daniel
Bought by
Hale Allisa
Home Financials for this Owner
Home Financials are based on the most recent Mortgage that was taken out on this home.
Original Mortgage
$109,900
Interest Rate
7.44%
Mortgage Type
Adjustable Rate Mortgage/ARM
Purchase Details
Closed on
Dec 5, 2002
Sold by
Lisek Ben Joseph
Bought by
Lisek Ben Joseph and Lisek Brian Daniel
Create a Home Valuation Report for This Property
The Home Valuation Report is an in-depth analysis detailing your home's value as well as a comparison with similar homes in the area
Home Values in the Area
Average Home Value in this Area
Purchase History
| Date | Buyer | Sale Price | Title Company |
|---|---|---|---|
| Seaway Bank & Trust Company | -- | None Available | |
| Bryant Tytrice L | $25,000 | -- | |
| Citimortgage Inc | -- | None Available | |
| Hale Allisa | $110,000 | Atgf Inc | |
| Lisek Ben Joseph | -- | -- |
Source: Public Records
Mortgage History
| Date | Status | Borrower | Loan Amount |
|---|---|---|---|
| Previous Owner | Hale Allisa | $109,900 |
Source: Public Records
Tax History
| Year | Tax Paid | Tax Assessment Tax Assessment Total Assessment is a certain percentage of the fair market value that is determined by local assessors to be the total taxable value of land and additions on the property. | Land | Improvement |
|---|---|---|---|---|
| 2025 | $2,024 | $7,500 | $959 | $6,541 |
| 2024 | $2,024 | $7,500 | $959 | $6,541 |
| 2023 | $300 | $7,500 | $959 | $6,541 |
| 2022 | $300 | $3,884 | $785 | $3,099 |
| 2021 | $349 | $3,882 | $784 | $3,098 |
| 2020 | $457 | $3,882 | $784 | $3,098 |
| 2019 | $700 | $4,658 | $697 | $3,961 |
| 2018 | $683 | $4,658 | $697 | $3,961 |
| 2017 | $724 | $4,658 | $697 | $3,961 |
| 2016 | $1,404 | $5,065 | $654 | $4,411 |
| 2015 | $1,241 | $5,065 | $654 | $4,411 |
| 2014 | $1,251 | $5,065 | $654 | $4,411 |
| 2013 | $2,006 | $7,085 | $654 | $6,431 |
Source: Public Records
Map
Nearby Homes
- 18215 Wentworth Ave Unit 3B
- 18405 Wentworth Ave Unit 1D
- 18316 Sherman St
- 18309 Grant St
- 18158 Lange St
- 18358 Willow Ln
- 18504 Wentworth Ave
- 18275 Ada St
- 18443 Maple St
- 3640 186th St Unit 101
- 3620 186th St Unit 405
- 3316 Ann St
- 18052 Wentworth Ave
- 18324 Roy St
- 3522 Washington St
- 18634 Bernadine St
- 3659 Madison St
- 3310 186th St
- 18315 Burnham Ave Unit 204
- 8147 Hohman Ave
- 18356 Myrtle Ct Unit 7
- 18356 Myrtle Ct Unit 10
- 18356 Myrtle Ct Unit 3
- 18356 Myrtle Ct Unit 12
- 18356 Myrtle Ct Unit 9
- 18356 Myrtle Ct Unit 11
- 18356 Myrtle Ct Unit 8
- 18356 Myrtle Ct Unit 2
- 18356 Myrtle Ct Unit 4
- 18326 Wentworth Ave
- 18361 West St
- 18352 Myrtle Ct
- 18371 West St
- 18347 West St
- 18346 Myrtle Ct
- 18332 Wentworth Ave
- 18332 Wentworth Ave Unit 1D
- 18332 Wentworth Ave Unit 1A
- 18332 Wentworth Ave Unit 2D
- 18332 Wentworth Ave Unit 2A
Your Personal Tour Guide
Ask me questions while you tour the home.