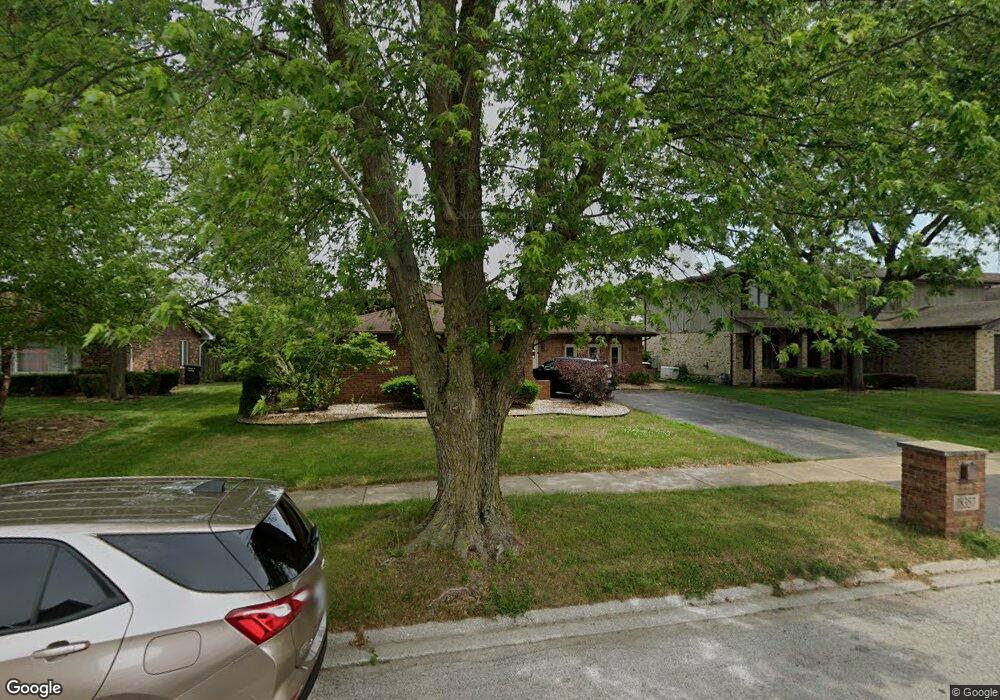
18357 Carriage Ln Lansing, IL 60438
Estimated Value: $225,000 - $328,483
3
Beds
2
Baths
1,210
Sq Ft
$224/Sq Ft
Est. Value
About This Home
This home is located at 18357 Carriage Ln, Lansing, IL 60438 and is currently estimated at $271,121, approximately $224 per square foot. 18357 Carriage Ln is a home located in Cook County with nearby schools including Oak Glen Elementary School, Memorial Jr High School, and Thornton Fractnl So High School.
Ownership History
Date
Name
Owned For
Owner Type
Purchase Details
Closed on
Mar 14, 2023
Sold by
Townsend Marie
Bought by
Texas Diamond M Texas
Current Estimated Value
Home Financials for this Owner
Home Financials are based on the most recent Mortgage that was taken out on this home.
Original Mortgage
$286,711
Outstanding Balance
$275,686
Interest Rate
5.75%
Mortgage Type
FHA
Estimated Equity
-$4,565
Purchase Details
Closed on
Oct 6, 2022
Sold by
Us Bank National Association
Bought by
Nirvana Property Investors Llc
Purchase Details
Closed on
Jun 30, 2022
Sold by
Judicial Sales Corporation
Bought by
Us Bank National Association
Purchase Details
Closed on
Aug 19, 2016
Sold by
Schlesser Norbert J and Schlesser Lori G
Bought by
Wells Shawn and Wells Shawn
Home Financials for this Owner
Home Financials are based on the most recent Mortgage that was taken out on this home.
Original Mortgage
$143,589
Interest Rate
3.5%
Mortgage Type
FHA
Create a Home Valuation Report for This Property
The Home Valuation Report is an in-depth analysis detailing your home's value as well as a comparison with similar homes in the area
Home Values in the Area
Average Home Value in this Area
Purchase History
| Date | Buyer | Sale Price | Title Company |
|---|---|---|---|
| Texas Diamond M Texas | $292,000 | None Listed On Document | |
| Nirvana Property Investors Llc | $125,500 | Proper Title | |
| Us Bank National Association | -- | None Listed On Document | |
| Wells Shawn | $147,000 | Attorney |
Source: Public Records
Mortgage History
| Date | Status | Borrower | Loan Amount |
|---|---|---|---|
| Open | Texas Diamond M Texas | $286,711 | |
| Previous Owner | Wells Shawn | $143,589 |
Source: Public Records
Tax History
| Year | Tax Paid | Tax Assessment Tax Assessment Total Assessment is a certain percentage of the fair market value that is determined by local assessors to be the total taxable value of land and additions on the property. | Land | Improvement |
|---|---|---|---|---|
| 2025 | $5,080 | $10,500 | $2,112 | $8,388 |
| 2024 | $5,080 | $10,500 | $2,112 | $8,388 |
| 2023 | $4,895 | $10,500 | $2,112 | $8,388 |
| 2022 | $4,895 | $7,532 | $1,824 | $5,708 |
| 2021 | $4,761 | $7,532 | $1,824 | $5,708 |
| 2020 | $4,419 | $7,532 | $1,824 | $5,708 |
| 2019 | $4,195 | $7,369 | $1,536 | $5,833 |
| 2018 | $4,118 | $7,369 | $1,536 | $5,833 |
| 2017 | $4,158 | $7,369 | $1,536 | $5,833 |
| 2016 | $2,816 | $6,398 | $1,440 | $4,958 |
| 2015 | $2,584 | $6,398 | $1,440 | $4,958 |
| 2014 | $2,562 | $6,398 | $1,440 | $4,958 |
| 2013 | $2,514 | $6,898 | $1,440 | $5,458 |
Source: Public Records
Map
Nearby Homes
- 18309 Bock Rd
- 18307 Locust St
- 2290 182nd Place
- 1943 182nd St
- 18550 Torrence Ave Unit 19
- 2340 186th St Unit 7
- 18340 Glen Oak Ave Unit 1D
- 18340 Glen Oak Ave Unit 3C
- 18539 Country Ln
- 2201 Thornton Lansing Rd
- 17750 Clyde Ave
- 2444 187th St
- 17934 Locust St
- 2444 187th Place
- 2621 Ridge Rd
- 2616 Ridge Rd
- 17871 Locust St
- 2643 Ridge Rd
- 18559 Escanaba Ave Unit 201
- 18559 Escanaba Ave Unit 305
- 18357 Carriage Ln
- 18401 Carriage Ln
- 18349 Carriage Ln
- 18349 Carriage Ln
- 18407 Carriage Ln
- 18374 Bock Rd
- 18368 Bock Rd
- 18400 Bock Rd
- 18362 Bock Rd
- 18341 Carriage Ln
- 18360 Carriage Ln
- 18411 Carriage Ln
- 18354 Carriage Ln
- 18406 Bock Rd
- 18400 Carriage Ln
- 18348 Carriage Ln
- 18356 Bock Rd
- 18406 Carriage Ln
- 18412 Bock Rd
- 18340 Carriage Ln