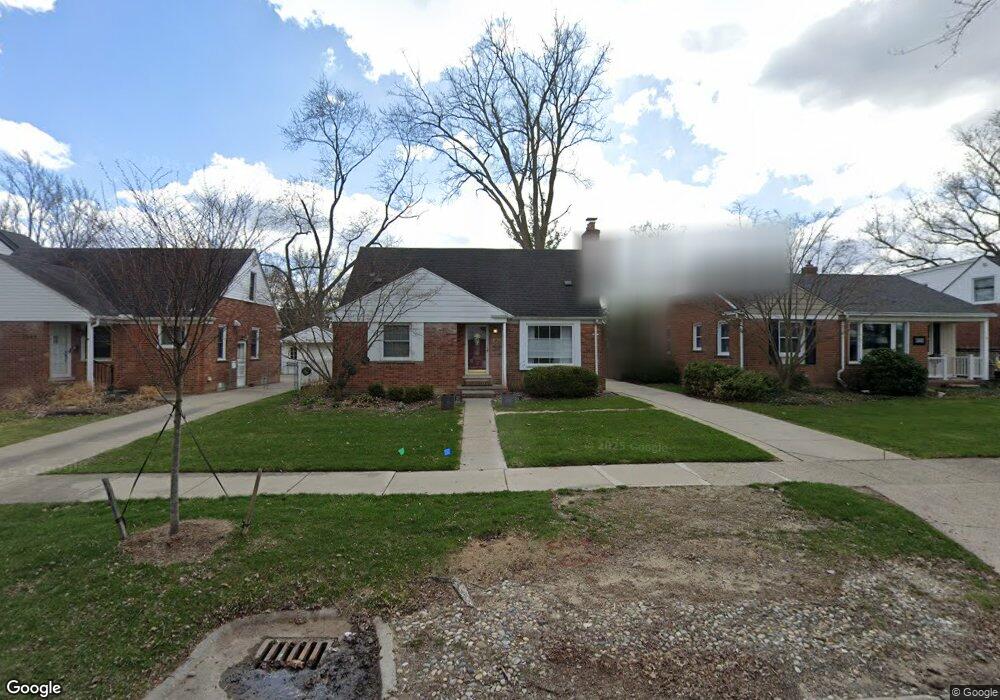
1836 Banbury St Unit Bldg-Unit Birmingham, MI 48009
Estimated Value: $433,518 - $528,000
3
Beds
1
Bath
1,152
Sq Ft
$399/Sq Ft
Est. Value
About This Home
This home is located at 1836 Banbury St Unit Bldg-Unit, Birmingham, MI 48009 and is currently estimated at $460,130, approximately $399 per square foot. 1836 Banbury St Unit Bldg-Unit is a home located in Oakland County with nearby schools including Pembroke Elementary School, Derby Middle School, and Ernest W. Seaholm High School.
Ownership History
Date
Name
Owned For
Owner Type
Purchase Details
Closed on
Jul 25, 2018
Sold by
Cibulka Stuart and Cibulka Stephanie
Bought by
Cameron Investment Property Llc
Current Estimated Value
Purchase Details
Closed on
Mar 18, 1998
Sold by
Cartwright Marceline S
Bought by
Cibulka Stuart
Home Financials for this Owner
Home Financials are based on the most recent Mortgage that was taken out on this home.
Original Mortgage
$130,500
Interest Rate
7.18%
Create a Home Valuation Report for This Property
The Home Valuation Report is an in-depth analysis detailing your home's value as well as a comparison with similar homes in the area
Home Values in the Area
Average Home Value in this Area
Purchase History
| Date | Buyer | Sale Price | Title Company |
|---|---|---|---|
| Cameron Investment Property Llc | $271,000 | None Available | |
| Cibulka Stuart | $163,150 | -- |
Source: Public Records
Mortgage History
| Date | Status | Borrower | Loan Amount |
|---|---|---|---|
| Previous Owner | Cibulka Stuart | $130,500 |
Source: Public Records
Tax History Compared to Growth
Tax History
| Year | Tax Paid | Tax Assessment Tax Assessment Total Assessment is a certain percentage of the fair market value that is determined by local assessors to be the total taxable value of land and additions on the property. | Land | Improvement |
|---|---|---|---|---|
| 2024 | $6,193 | $179,030 | $0 | $0 |
| 2023 | $5,910 | $160,540 | $0 | $0 |
| 2022 | $7,125 | $152,820 | $0 | $0 |
| 2021 | $6,946 | $147,220 | $0 | $0 |
| 2020 | $5,508 | $137,350 | $0 | $0 |
| 2019 | $6,824 | $129,470 | $0 | $0 |
| 2018 | $4,599 | $127,670 | $0 | $0 |
| 2017 | $4,533 | $124,530 | $0 | $0 |
| 2016 | $3,709 | $121,030 | $0 | $0 |
| 2015 | -- | $114,830 | $0 | $0 |
| 2014 | -- | $95,910 | $0 | $0 |
| 2011 | -- | $81,540 | $0 | $0 |
Source: Public Records
Map
Nearby Homes
- 2070 Sheffield Rd
- 1717 Penistone St
- 1552 Bennaville Ave
- 1982 E Lincoln St
- 1458 Chapin Ave
- 1532 Cheltenham Rd
- 1368 Bennaville Ave
- 1427 Humphrey Ave
- 1760 Cole St
- 1590 Cheltenham Rd
- 000 Taunton Rd
- 1963 Cole St
- 1745 Webster St
- 1268 Davis Ave
- 1840 Holland St
- 1135 Chapin Ave
- 1106 Bennaville Ave
- 1982 Haynes St
- 1489 Holland St
- 1324 Holland St
- 1836 Banbury St
- 1824 Banbury St
- 1814 Banbury St
- 1848 Banbury St
- 1860 Banbury St
- 1567 Penistone St
- 1573 Penistone St
- 1810 Banbury St
- 1575 Penistone St
- 1872 Banbury St
- 1827 Banbury St
- 1847 Banbury St
- 1561 Penistone St
- 1835 Banbury St
- 1884 Banbury St
- 1815 Banbury St
- 1555 Penistone St
- 1587 Penistone St
- 1807 Banbury St
- 1857 Banbury St