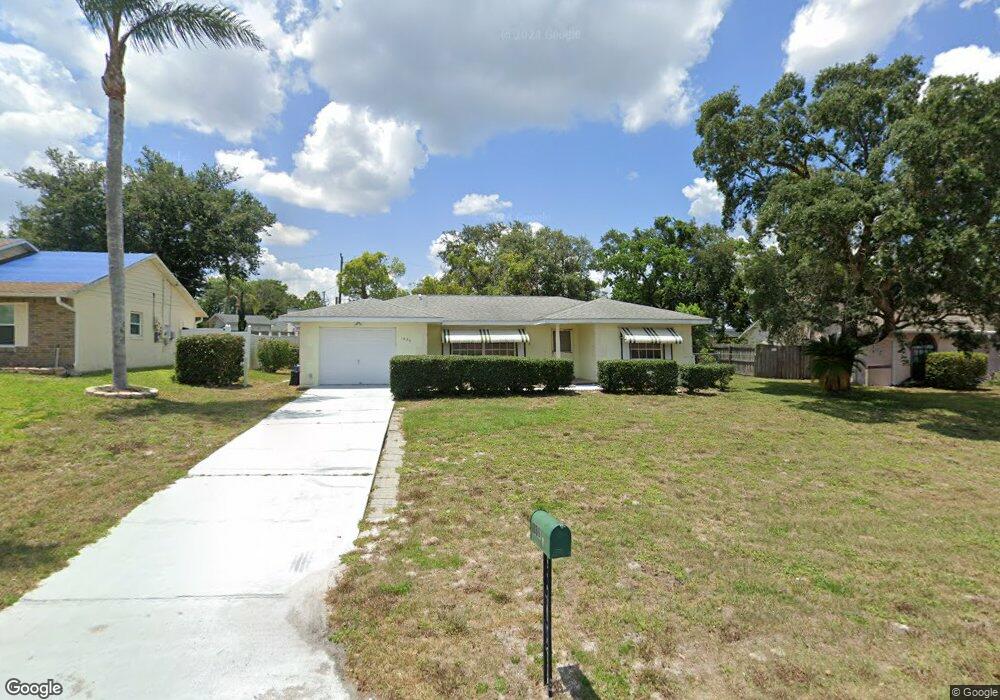
1836 Portview Ave Deltona, FL 32738
Estimated Value: $190,000 - $252,000
2
Beds
2
Baths
1,631
Sq Ft
$142/Sq Ft
Est. Value
About This Home
This home is located at 1836 Portview Ave, Deltona, FL 32738 and is currently estimated at $231,998, approximately $142 per square foot. 1836 Portview Ave is a home located in Volusia County with nearby schools including Deltona Lakes Elementary School, Galaxy Middle School, and Deltona High School.
Ownership History
Date
Name
Owned For
Owner Type
Purchase Details
Closed on
Mar 12, 2021
Sold by
Boyd Jimmy and Boyd Margaret
Bought by
Boyd Jimmy L and Boyd Margaret A
Current Estimated Value
Purchase Details
Closed on
Jan 30, 2013
Sold by
Fannie Mae
Bought by
Boyd Jimmy and Boyd Margaret
Purchase Details
Closed on
Sep 25, 2012
Sold by
Ball Hope and Hart Steven Philip
Bought by
Federal National Mortgage Association
Purchase Details
Closed on
Jan 25, 2007
Sold by
Benson Joseph
Bought by
Ball Steven and Ball Hope
Home Financials for this Owner
Home Financials are based on the most recent Mortgage that was taken out on this home.
Original Mortgage
$22,500
Interest Rate
6.07%
Mortgage Type
Stand Alone Second
Purchase Details
Closed on
Sep 15, 1979
Bought by
Boyd Jimmy and Boyd Margaret
Purchase Details
Closed on
Dec 15, 1978
Bought by
Boyd Jimmy and Boyd Margaret
Purchase Details
Closed on
Oct 15, 1972
Bought by
Boyd Jimmy and Boyd Margaret
Create a Home Valuation Report for This Property
The Home Valuation Report is an in-depth analysis detailing your home's value as well as a comparison with similar homes in the area
Home Values in the Area
Average Home Value in this Area
Purchase History
| Date | Buyer | Sale Price | Title Company |
|---|---|---|---|
| Boyd Jimmy L | -- | Attorney | |
| Boyd Jimmy | $60,000 | Attorney | |
| Federal National Mortgage Association | -- | None Available | |
| Ball Steven | $150,000 | B D R Title | |
| Boyd Jimmy | $35,200 | -- | |
| Boyd Jimmy | $2,800 | -- | |
| Boyd Jimmy | $1,500 | -- |
Source: Public Records
Mortgage History
| Date | Status | Borrower | Loan Amount |
|---|---|---|---|
| Previous Owner | Ball Steven | $22,500 |
Source: Public Records
Tax History Compared to Growth
Tax History
| Year | Tax Paid | Tax Assessment Tax Assessment Total Assessment is a certain percentage of the fair market value that is determined by local assessors to be the total taxable value of land and additions on the property. | Land | Improvement |
|---|---|---|---|---|
| 2025 | $4,105 | $198,280 | $52,800 | $145,480 |
| 2024 | $4,105 | $199,024 | $52,800 | $146,224 |
| 2023 | $4,105 | $199,803 | $58,000 | $141,803 |
| 2022 | $3,805 | $172,337 | $40,800 | $131,537 |
| 2021 | $2,963 | $136,236 | $26,400 | $109,836 |
| 2020 | $2,704 | $119,067 | $24,000 | $95,067 |
| 2019 | $2,629 | $115,565 | $17,600 | $97,965 |
| 2018 | $2,439 | $102,468 | $16,000 | $86,468 |
| 2017 | $2,255 | $88,188 | $8,400 | $79,788 |
| 2016 | $2,012 | $74,015 | $0 | $0 |
| 2015 | $1,892 | $66,009 | $0 | $0 |
| 2014 | $1,737 | $59,789 | $0 | $0 |
Source: Public Records
Map
Nearby Homes
- 1818 Portview Ave
- 1887 Lynn River Dr
- 1833 Providence Blvd
- 1875 Monticello St
- 1855 E Chapel Dr
- 1850 Providence Blvd
- 1854 Providence Blvd
- 1819 E Chapel Dr
- 2057 Heathwood St
- 1792 Monticello St
- 2023 Alameda Dr
- 1846 N Acadian Dr
- 1757 W Acadian Dr
- 1784 Providence Blvd
- 1797 N Acadian Dr
- 1880 N Merrick Dr
- 2078 Elkcam Blvd
- 2115 Elkcam Blvd
- 1825 Alameda Dr
- 1618 Airmont Ave
- 1844 Portview Ave
- 1826 Portview Ave
- 1855 Evard Ct
- 1850 Evard Ct
- 1854 Portview Ave
- 1837 Portview Ave
- 1827 Portview Ave
- 1861 Evard Ct
- 1813 Portview Ave
- 1855 Portview Ave
- 1862 Portview Ave
- 1856 Evard Ct
- 1808 Portview Ave
- 1831 Bestland Ave
- 1970 Lynn River Dr
- 1962 Lynn River Dr
- 1976 Lynn River Dr
- 1821 Bestland Ave
- 1860 Evard Ct
- 1801 Portview Ave