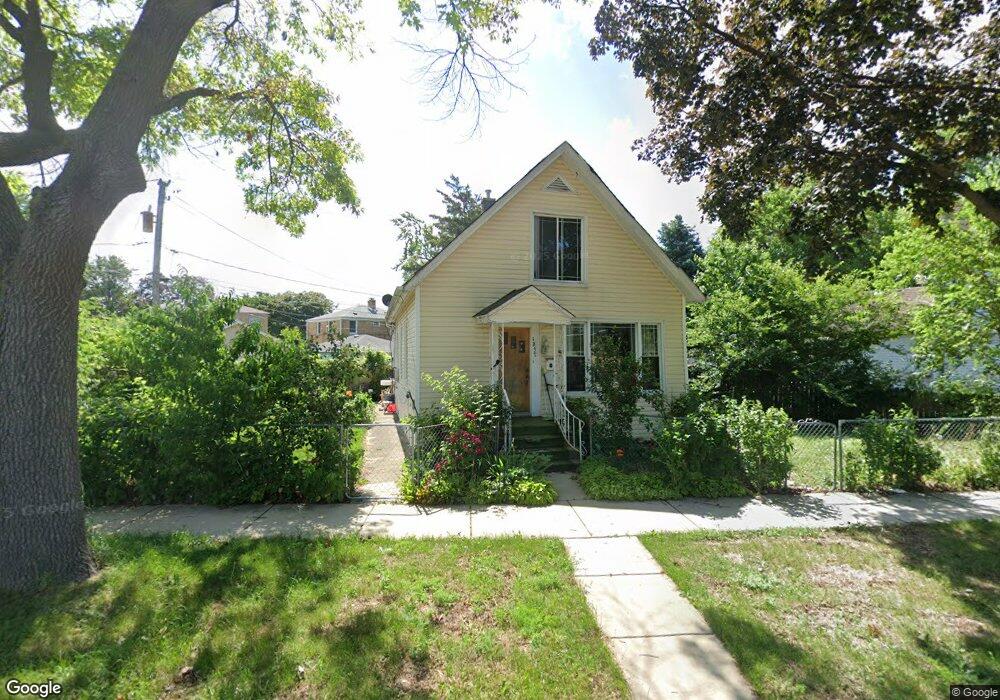
1837 Circle St Des Plaines, IL 60018
Estimated Value: $302,000 - $444,000
4
Beds
2
Baths
1,564
Sq Ft
$238/Sq Ft
Est. Value
About This Home
This home is located at 1837 Circle St, Des Plaines, IL 60018 and is currently estimated at $372,646, approximately $238 per square foot. 1837 Circle St is a home located in Cook County with nearby schools including South Elementary School, Algonquin Middle School, and Maine West High School.
Ownership History
Date
Name
Owned For
Owner Type
Purchase Details
Closed on
Jun 29, 2018
Sold by
Meza Avalos Isidro and Meza Manzo Gabriela
Bought by
Manzo Gabriela Meza
Current Estimated Value
Purchase Details
Closed on
Jun 21, 2001
Sold by
Meza Avalos Isidro and Meza Manzo Gabriela
Bought by
Meza Avalos Isidro and Meza Manzo Gabriela
Home Financials for this Owner
Home Financials are based on the most recent Mortgage that was taken out on this home.
Original Mortgage
$149,400
Outstanding Balance
$55,133
Interest Rate
7.2%
Estimated Equity
$317,513
Purchase Details
Closed on
Dec 15, 1999
Sold by
Cuonzo Joan and Scheufler Kathleen
Bought by
Meza Gabriela and Avalos Isidro
Home Financials for this Owner
Home Financials are based on the most recent Mortgage that was taken out on this home.
Original Mortgage
$148,773
Interest Rate
7.7%
Mortgage Type
FHA
Create a Home Valuation Report for This Property
The Home Valuation Report is an in-depth analysis detailing your home's value as well as a comparison with similar homes in the area
Home Values in the Area
Average Home Value in this Area
Purchase History
| Date | Buyer | Sale Price | Title Company |
|---|---|---|---|
| Manzo Gabriela Meza | -- | None Available | |
| Meza Avalos Isidro | -- | Chicago Title Insurance Co | |
| Meza Gabriela | $150,000 | -- |
Source: Public Records
Mortgage History
| Date | Status | Borrower | Loan Amount |
|---|---|---|---|
| Open | Meza Avalos Isidro | $149,400 | |
| Closed | Meza Gabriela | $148,773 |
Source: Public Records
Tax History
| Year | Tax Paid | Tax Assessment Tax Assessment Total Assessment is a certain percentage of the fair market value that is determined by local assessors to be the total taxable value of land and additions on the property. | Land | Improvement |
|---|---|---|---|---|
| 2025 | $5,717 | $36,000 | $4,284 | $31,716 |
| 2024 | $5,717 | $25,000 | $3,570 | $21,430 |
| 2023 | $5,553 | $25,000 | $3,570 | $21,430 |
| 2022 | $5,553 | $25,000 | $3,570 | $21,430 |
| 2021 | $5,885 | $22,476 | $2,975 | $19,501 |
| 2020 | $5,855 | $22,476 | $2,975 | $19,501 |
| 2019 | $5,873 | $25,254 | $2,975 | $22,279 |
| 2018 | $5,404 | $21,504 | $2,618 | $18,886 |
| 2017 | $5,326 | $21,504 | $2,618 | $18,886 |
| 2016 | $5,282 | $21,504 | $2,618 | $18,886 |
| 2015 | $5,582 | $21,086 | $2,261 | $18,825 |
| 2014 | $5,480 | $21,086 | $2,261 | $18,825 |
| 2013 | $5,326 | $21,086 | $2,261 | $18,825 |
Source: Public Records
Map
Nearby Homes
- 1445 Everett Ave
- 1696 S Elm St
- 1689 S Elm St
- 1645 Illinois St
- 1721 Prospect Ave
- 1370 Fargo Ave Unit E
- 2220 S Chestnut St
- 1080 Bogart St
- 1640 S River Rd
- 1700 E Forest Ave
- 1922 Fargo Ave
- 1629 E Touhy Ave
- 1641 E Touhy Ave
- 815 E Oakton St Unit 311
- 1990 Berry Ln
- 1458 Kingston Ct
- 1394 Carol Ln
- 1738 Lunt Ave
- 635 Birchwood Ave
- 1630 Henry Ave
- 1834 Illinois St
- 1834 Illinois St
- 1824 Illinois St
- 1842 Illinois St
- 1469 Everett Ave
- 1820 Illinois St
- 1856 Illinois St
- 1856 Illinois St
- 1485 Everett Ave
- 1457 Everett Ave
- 1447 Everett Ave
- 1447 Everett Ave
- 1826 Circle St
- 1836 Circle St
- 1864 Illinois St
- 1840 Circle St
- 1843 Illinois St
- 1445 Everett Ave
- 1841 Illinois St
- 1833 Illinois St
Your Personal Tour Guide
Ask me questions while you tour the home.