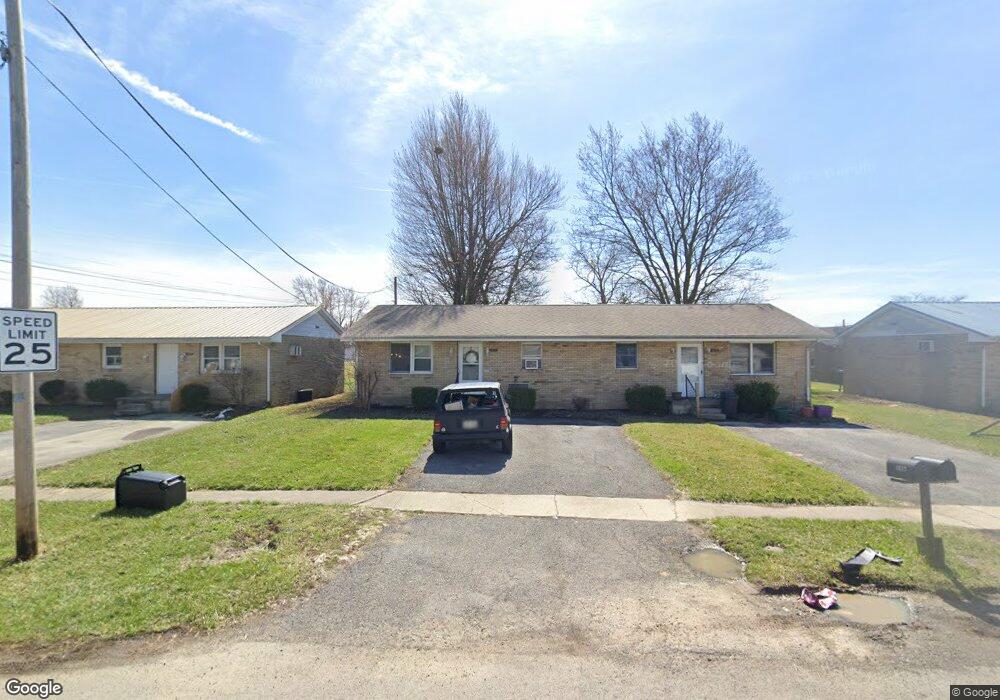
1837 Foraker Ave Unit 1837 Findlay, OH 45840
Estimated Value: $128,009 - $162,000
4
Beds
2
Baths
1,456
Sq Ft
$102/Sq Ft
Est. Value
About This Home
This home is located at 1837 Foraker Ave Unit 1837, Findlay, OH 45840 and is currently estimated at $148,752, approximately $102 per square foot. 1837 Foraker Ave Unit 1837 is a home located in Hancock County with nearby schools including Chamberlin Hill Elementary School, Jefferson Elementary School, and Donnell Middle School.
Ownership History
Date
Name
Owned For
Owner Type
Purchase Details
Closed on
May 18, 2009
Sold by
Morcap Real Estate Opportunity Fund I Ll
Bought by
Olmstead Jason R
Current Estimated Value
Purchase Details
Closed on
Mar 19, 2009
Sold by
Realholdings Llc
Bought by
Morcap Real Estate Opportunity Fund I Ll
Purchase Details
Closed on
Oct 31, 2008
Sold by
Deutsche Bank National Trust Company
Bought by
Blue Spruce Entities Llc
Purchase Details
Closed on
Oct 23, 2008
Sold by
Blue Spruce Entities Llc
Bought by
Realholdings Llc
Purchase Details
Closed on
Jul 10, 2008
Sold by
Miller Leahbell and Four Acres Condominiums
Bought by
Deutsche Bank National Trust Co and Hsi Asset Securitization Corp 2007-Opt1
Purchase Details
Closed on
Aug 17, 1995
Sold by
Dick Gary
Bought by
Bucher David and Bucher Deborah
Create a Home Valuation Report for This Property
The Home Valuation Report is an in-depth analysis detailing your home's value as well as a comparison with similar homes in the area
Home Values in the Area
Average Home Value in this Area
Purchase History
| Date | Buyer | Sale Price | Title Company |
|---|---|---|---|
| Olmstead Jason R | $20,000 | Service Link | |
| Morcap Real Estate Opportunity Fund I Ll | -- | Service Link | |
| Blue Spruce Entities Llc | $2,733 | None Available | |
| Realholdings Llc | $2,733 | Service Link | |
| Deutsche Bank National Trust Co | $25,000 | Whitman Title | |
| Bucher David | $55,000 | -- |
Source: Public Records
Tax History Compared to Growth
Tax History
| Year | Tax Paid | Tax Assessment Tax Assessment Total Assessment is a certain percentage of the fair market value that is determined by local assessors to be the total taxable value of land and additions on the property. | Land | Improvement |
|---|---|---|---|---|
| 2024 | $1,288 | $35,340 | $5,060 | $30,280 |
| 2023 | $1,290 | $35,340 | $5,060 | $30,280 |
| 2022 | $1,286 | $35,340 | $5,060 | $30,280 |
| 2021 | $1,687 | $40,390 | $5,220 | $35,170 |
| 2020 | $1,687 | $40,390 | $5,220 | $35,170 |
| 2019 | $1,654 | $32,370 | $5,220 | $27,150 |
| 2018 | $1,445 | $32,370 | $5,220 | $27,150 |
| 2017 | $1,445 | $32,370 | $5,220 | $27,150 |
| 2016 | $1,433 | $32,370 | $5,220 | $27,150 |
| 2015 | $1,287 | $28,610 | $5,220 | $23,390 |
Source: Public Records
Map
Nearby Homes
- 0 Bushwillow Dr Unit Lot 154
- 0 Bushwillow Dr Lot 156 Unit 6079046
- 0 Rock Candy Rd Lot 162 Unit 6079070
- 0 Bushwillow Dr Unit Lot 156
- 0 Bearcat Way Or 0 Rock Candy Rd Lot 167 Unit 6079083
- 0 Bushwillow Dr Lot 154 Unit 6079043
- 0 Rock Candy Rd Lot 171 Unit 6079088
- 0 County Road 99 Lot 2 Unit 6081480
- 0 Rock Candy Rd Lot 159 Unit 6079053
- 0 Bushwillow Dr Or Rock Candy Rd Lot 157 Unit 6079052
- 0 Bushwillow Dr Unit Lot 155
- 0 Rock Candy Rd Or Bushwillow Dr Lot 173 Unit 6079093
- 0 Rock Candy Rd Lot 168 Unit 6079085
- 0 Rock Candy Rd Lot 170 Unit 6079087
- 0 Bushwillow Dr Lot 155 Unit 6079044
- 1604 Payne Ave
- 0 Waterford Way Lot 78 Unit 6089639
- 10601 County Road 9
- 9653 Early Dr
- 9307 Hiegel Dr
- 1839 Foraker Ave
- 1833 Foraker Ave
- 1835 Foraker Ave
- 1841 Foraker Ave
- 1711 Carlin St
- 1713 Carlin St
- 1836 Payne Ave
- 1831 Foraker Ave
- 1840 Foraker Ave
- 1848 Foraker Ave
- 1821 Foraker Ave
- 1830 Foraker Ave
- 1820 Payne Ave
- 1811 Foraker Ave
- 1826 Foraker Ave
- 1814 Payne Ave
- 1700 Carlin St
- 1843 Payne Ave
- 1839 Byal Ave
- 1837 Payne Ave