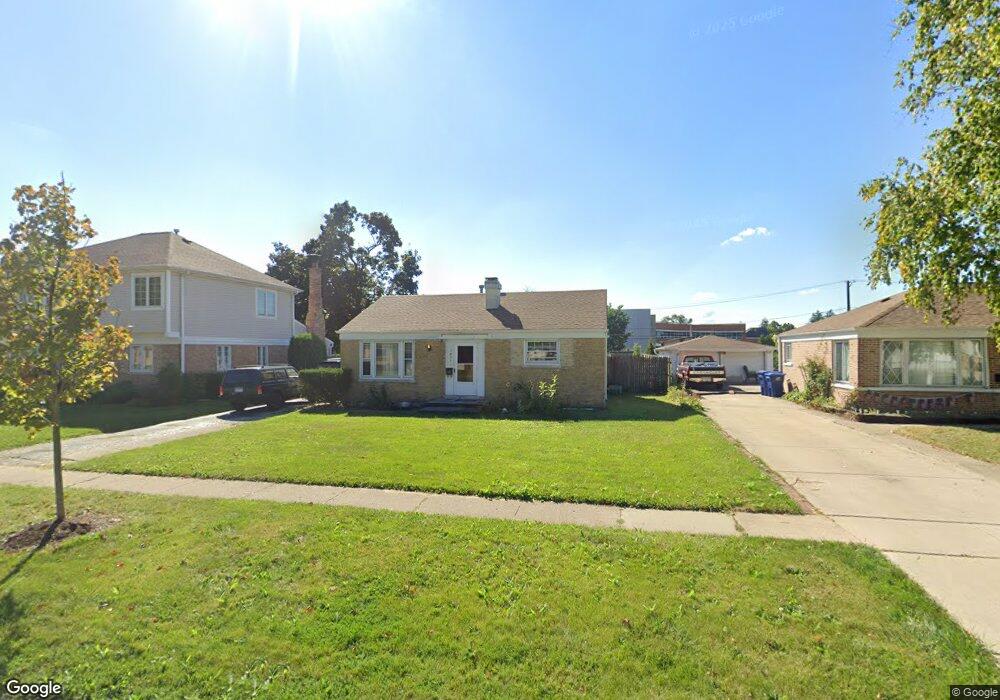
1837 Morse Ave Des Plaines, IL 60018
Estimated Value: $287,000 - $356,000
2
Beds
1
Bath
884
Sq Ft
$362/Sq Ft
Est. Value
About This Home
This home is located at 1837 Morse Ave, Des Plaines, IL 60018 and is currently estimated at $320,017, approximately $362 per square foot. 1837 Morse Ave is a home located in Cook County with nearby schools including Orchard Place Elementary School, Algonquin Middle School, and Maine West High School.
Ownership History
Date
Name
Owned For
Owner Type
Purchase Details
Closed on
Jul 19, 2017
Sold by
Janecek Gary D and Janecek Renae
Bought by
Decook Jason E
Current Estimated Value
Home Financials for this Owner
Home Financials are based on the most recent Mortgage that was taken out on this home.
Original Mortgage
$196,377
Outstanding Balance
$161,871
Interest Rate
3.87%
Mortgage Type
FHA
Estimated Equity
$158,146
Purchase Details
Closed on
Dec 6, 2012
Sold by
Basta Pawel
Bought by
Janecek Gary D
Home Financials for this Owner
Home Financials are based on the most recent Mortgage that was taken out on this home.
Original Mortgage
$121,184
Interest Rate
3.5%
Mortgage Type
FHA
Purchase Details
Closed on
Mar 15, 2004
Sold by
Sanchez Steven L
Bought by
Basta Pawel
Home Financials for this Owner
Home Financials are based on the most recent Mortgage that was taken out on this home.
Original Mortgage
$239,200
Interest Rate
8.65%
Mortgage Type
Unknown
Create a Home Valuation Report for This Property
The Home Valuation Report is an in-depth analysis detailing your home's value as well as a comparison with similar homes in the area
Home Values in the Area
Average Home Value in this Area
Purchase History
| Date | Buyer | Sale Price | Title Company |
|---|---|---|---|
| Decook Jason E | $200,000 | Precision Title | |
| Janecek Gary D | $123,500 | Greater Metropolitan Title L | |
| Basta Pawel | $239,500 | -- |
Source: Public Records
Mortgage History
| Date | Status | Borrower | Loan Amount |
|---|---|---|---|
| Open | Decook Jason E | $196,377 | |
| Previous Owner | Janecek Gary D | $121,184 | |
| Previous Owner | Basta Pawel | $239,200 |
Source: Public Records
Tax History
| Year | Tax Paid | Tax Assessment Tax Assessment Total Assessment is a certain percentage of the fair market value that is determined by local assessors to be the total taxable value of land and additions on the property. | Land | Improvement |
|---|---|---|---|---|
| 2025 | $4,663 | $26,000 | $9,450 | $16,550 |
| 2024 | $4,663 | $21,000 | $7,875 | $13,125 |
| 2023 | $4,524 | $21,000 | $7,875 | $13,125 |
| 2022 | $4,524 | $21,000 | $7,875 | $13,125 |
| 2021 | $5,468 | $17,788 | $6,562 | $11,226 |
| 2020 | $5,375 | $17,788 | $6,562 | $11,226 |
| 2019 | $5,379 | $19,987 | $6,562 | $13,425 |
| 2018 | $5,449 | $18,219 | $5,775 | $12,444 |
| 2017 | $5,352 | $18,219 | $5,775 | $12,444 |
| 2016 | $5,063 | $18,219 | $5,775 | $12,444 |
| 2015 | $5,406 | $17,883 | $4,987 | $12,896 |
| 2014 | $5,292 | $17,883 | $4,987 | $12,896 |
| 2013 | $5,160 | $17,883 | $4,987 | $12,896 |
Source: Public Records
Map
Nearby Homes
- 2646 Maple St
- 1757 Farwell Ave
- 2609 Eisenhower Dr
- 2600 S Scott St
- 1641 E Touhy Ave
- 1629 E Touhy Ave
- 1738 Lunt Ave
- 2945 S Scott St
- 2124 Halsey Dr
- 3051 S Scott St
- 2469 Parkwood Ln
- 38 E Touhy Ave
- 1922 Fargo Ave
- 2220 S Chestnut St
- 1370 Fargo Ave Unit E
- 1721 Prospect Ave
- 300 Thames Pkwy Unit 3D
- 201 Thames Pkwy Unit 2F
- 201 Thames Pkwy Unit 2K
- 6013 N Emerson St
Your Personal Tour Guide
Ask me questions while you tour the home.