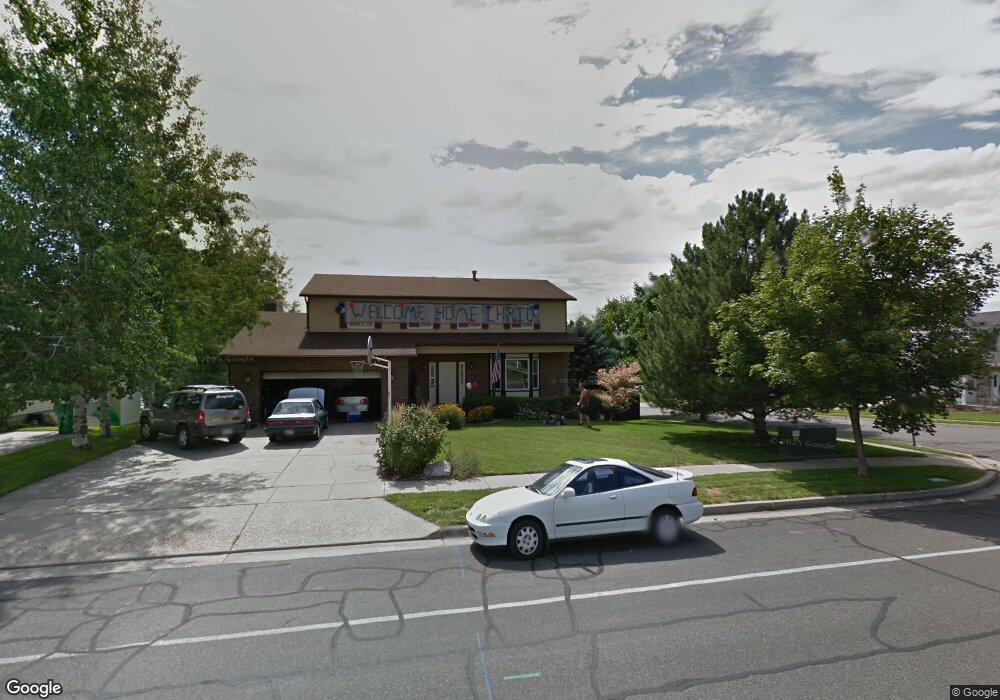
1837 N 400 W Centerville, UT 84014
Estimated Value: $766,000 - $804,000
6
Beds
4
Baths
3,775
Sq Ft
$207/Sq Ft
Est. Value
About This Home
This home is located at 1837 N 400 W, Centerville, UT 84014 and is currently estimated at $780,704, approximately $206 per square foot. 1837 N 400 W is a home located in Davis County with nearby schools including Reading School, Centerville Jr High, and Viewmont High School.
Ownership History
Date
Name
Owned For
Owner Type
Purchase Details
Closed on
May 13, 2022
Sold by
Mccool Christopher J
Bought by
Womack George A and Womack Varalyn R
Current Estimated Value
Home Financials for this Owner
Home Financials are based on the most recent Mortgage that was taken out on this home.
Original Mortgage
$422,000
Outstanding Balance
$400,498
Interest Rate
5.3%
Mortgage Type
New Conventional
Estimated Equity
$380,206
Purchase Details
Closed on
Jul 25, 2019
Sold by
Friddle Tory L and Friddle Kathryn M
Bought by
Mccool Christopher J and Mccool Monica C
Home Financials for this Owner
Home Financials are based on the most recent Mortgage that was taken out on this home.
Original Mortgage
$379,687
Interest Rate
3.82%
Mortgage Type
VA
Create a Home Valuation Report for This Property
The Home Valuation Report is an in-depth analysis detailing your home's value as well as a comparison with similar homes in the area
Home Values in the Area
Average Home Value in this Area
Purchase History
| Date | Buyer | Sale Price | Title Company |
|---|---|---|---|
| Womack George A | -- | None Listed On Document | |
| Mccool Christopher J | -- | North American Title Llc |
Source: Public Records
Mortgage History
| Date | Status | Borrower | Loan Amount |
|---|---|---|---|
| Open | Womack George A | $422,000 | |
| Previous Owner | Mccool Christopher J | $379,687 |
Source: Public Records
Tax History Compared to Growth
Tax History
| Year | Tax Paid | Tax Assessment Tax Assessment Total Assessment is a certain percentage of the fair market value that is determined by local assessors to be the total taxable value of land and additions on the property. | Land | Improvement |
|---|---|---|---|---|
| 2025 | $226 | $380,050 | $157,440 | $222,610 |
| 2024 | $200 | $381,150 | $142,053 | $239,097 |
| 2023 | $447 | $657,000 | $232,302 | $424,698 |
| 2022 | $1,175 | $353,650 | $117,444 | $236,206 |
| 2021 | $3,677 | $497,000 | $180,012 | $316,988 |
| 2020 | $3,061 | $427,000 | $175,461 | $251,539 |
| 2019 | $3,054 | $431,000 | $174,678 | $256,322 |
| 2018 | $2,866 | $401,000 | $162,020 | $238,980 |
| 2016 | $2,518 | $197,230 | $52,439 | $144,791 |
| 2015 | $2,467 | $183,040 | $52,439 | $130,601 |
| 2014 | $2,246 | $170,807 | $52,439 | $118,368 |
| 2013 | -- | $160,803 | $40,624 | $120,179 |
Source: Public Records
Map
Nearby Homes
- 1927 N 450 W
- 455 W 2025 N
- 733 W 1825 N
- 283 W Summerhill Ln
- 1851 N Main St
- 551 W Summerhill Ln
- 581 W Summerhill Ln
- 5 W Summerhill Ln
- 43 E 1825 N
- 56 E 2050 N
- Cantata Plan at Summerhill Lane
- Kilby Plan at Summerhill Lane
- Rhapsody Plan at Summerhill Lane
- Ballad Plan at Summerhill Lane
- Grand Plan at Summerhill Lane
- Yalecrest Plan at Summerhill Lane
- Trio Plan at Summerhill Lane
- Abravanel Plan at Summerhill Lane
- Browning Plan at Summerhill Lane
- Kingsbury Plan at Summerhill Lane