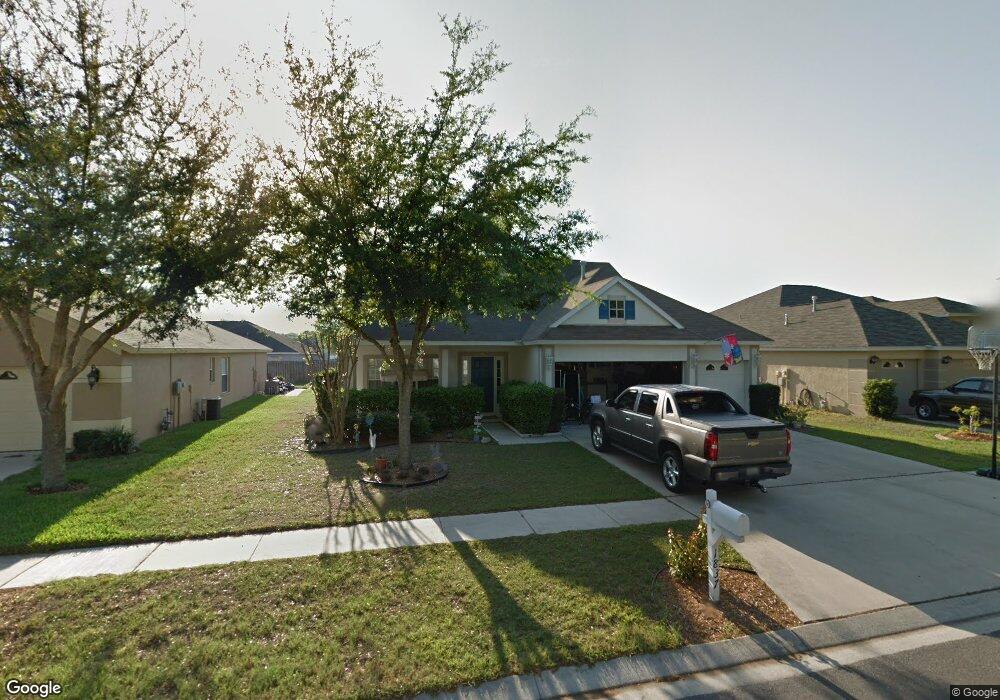
1837 S Ridge Dr Valrico, FL 33594
Estimated Value: $396,000 - $429,000
4
Beds
3
Baths
2,991
Sq Ft
$138/Sq Ft
Est. Value
About This Home
This home is located at 1837 S Ridge Dr, Valrico, FL 33594 and is currently estimated at $411,751, approximately $137 per square foot. 1837 S Ridge Dr is a home located in Hillsborough County with nearby schools including Nelson Elementary School, Mulrennan Middle School, and Durant High School.
Ownership History
Date
Name
Owned For
Owner Type
Purchase Details
Closed on
Jun 30, 2017
Sold by
Ngo Tim Seikei and Ngo Sherrie
Bought by
Borud Stephanie S and Borud Paul Phillip
Current Estimated Value
Home Financials for this Owner
Home Financials are based on the most recent Mortgage that was taken out on this home.
Original Mortgage
$238,000
Outstanding Balance
$198,441
Interest Rate
4.02%
Mortgage Type
VA
Estimated Equity
$213,310
Purchase Details
Closed on
Jul 20, 2016
Sold by
Cheshire Christine M
Bought by
Ngo Tim Seikei
Purchase Details
Closed on
Jul 1, 2016
Bought by
Borud Stephanie S
Purchase Details
Closed on
Apr 9, 1999
Sold by
Windward Homes Inc
Bought by
Ngo Tim S and Ngo Christine M
Home Financials for this Owner
Home Financials are based on the most recent Mortgage that was taken out on this home.
Original Mortgage
$117,900
Interest Rate
6.85%
Mortgage Type
New Conventional
Create a Home Valuation Report for This Property
The Home Valuation Report is an in-depth analysis detailing your home's value as well as a comparison with similar homes in the area
Home Values in the Area
Average Home Value in this Area
Purchase History
| Date | Buyer | Sale Price | Title Company |
|---|---|---|---|
| Borud Stephanie S | $238,000 | Fidelity Natl Title Of Flori | |
| Ngo Tim Seikei | -- | Fidelity National Title Of F | |
| Borud Stephanie S | $100 | -- | |
| Ngo Tim S | $30,000 | -- | |
| Windward Homes Inc | $21,600 | -- |
Source: Public Records
Mortgage History
| Date | Status | Borrower | Loan Amount |
|---|---|---|---|
| Open | Borud Stephanie S | $238,000 | |
| Previous Owner | Windward Homes Inc | $122,900 | |
| Previous Owner | Windward Homes Inc | $117,900 |
Source: Public Records
Tax History Compared to Growth
Tax History
| Year | Tax Paid | Tax Assessment Tax Assessment Total Assessment is a certain percentage of the fair market value that is determined by local assessors to be the total taxable value of land and additions on the property. | Land | Improvement |
|---|---|---|---|---|
| 2024 | $2,640 | $164,307 | -- | -- |
| 2023 | $2,522 | $159,521 | $0 | $0 |
| 2022 | $2,360 | $154,875 | $0 | $0 |
| 2021 | $2,312 | $150,364 | $0 | $0 |
| 2020 | $2,227 | $148,288 | $0 | $0 |
| 2019 | $2,133 | $144,954 | $0 | $0 |
| 2018 | $2,112 | $142,251 | $0 | $0 |
| 2017 | $3,247 | $155,662 | $0 | $0 |
| 2016 | $1,987 | $116,810 | $0 | $0 |
| 2015 | $2,005 | $115,998 | $0 | $0 |
| 2014 | $1,980 | $115,077 | $0 | $0 |
| 2013 | -- | $113,376 | $0 | $0 |
Source: Public Records
Map
Nearby Homes
- 1617 Cherokee Trail
- 1521 Banner Elk St
- 4541 Mohican Trail
- 4404 Echo Springs Dr
- 2216 Glen Mist Dr
- 4514 Highfalls Dr
- 1802 Parkwood Dr
- 2601 Villa Dr
- 1807 Parkwood Dr
- 4139 Yellowwood Dr
- 1710 Tallowtree Cir
- 4107 Robin Way
- 4922 Copper Canyon Blvd
- 2701 Herndon St
- 4001 Highgate Dr
- 2806 Springdell Cir
- 4309 Balington Dr
- 3822 Ravenna Dr
- 2763 Valencia Grove Dr
- 3820 Ravenna Dr
- 1839 S Ridge Dr
- 1835 S Ridge Dr
- 1813 Palm Ridge Place Unit 1
- 1811 Palm Ridge Place
- 1815 Palm Ridge Place
- 1833 S Ridge Dr
- 1841 S Ridge Dr
- 1836 S Ridge Dr
- 1838 S Ridge Dr
- 1817 Palm Ridge Place
- 1834 S Ridge Dr
- 1834 South Ridge Dr
- 1809 Palm Ridge Place
- 1840 S Ridge Dr
- 1831 S Ridge Dr
- 1832 South Ridge Dr Unit 1
- 1819 Palm Ridge Place
- 1842 South Ridge Dr Unit 1
- 1842 S Ridge Dr
- 1814 Palm Ridge Place