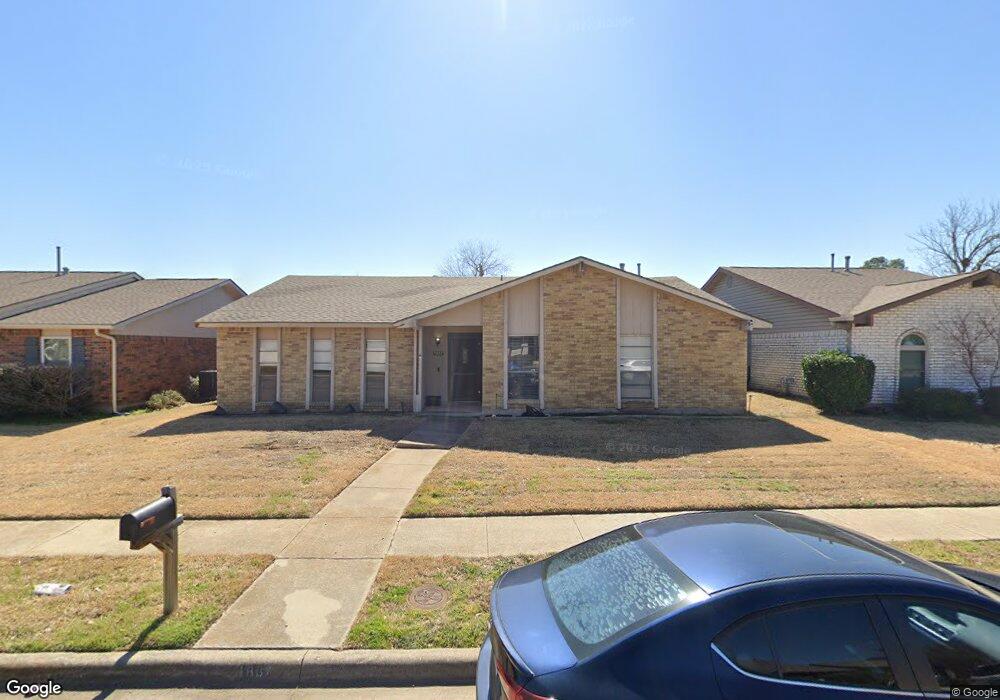
1837 Sandy Ridge Ct Carrollton, TX 75007
Woodlake NeighborhoodEstimated Value: $388,829 - $418,000
4
Beds
2
Baths
2,111
Sq Ft
$193/Sq Ft
Est. Value
About This Home
This home is located at 1837 Sandy Ridge Ct, Carrollton, TX 75007 and is currently estimated at $408,207, approximately $193 per square foot. 1837 Sandy Ridge Ct is a home located in Denton County with nearby schools including Davis Elementary School, Blalack Middle School, and Creekview High School.
Ownership History
Date
Name
Owned For
Owner Type
Purchase Details
Closed on
Oct 27, 2011
Sold by
Blackerby Sharon L and Blackerby Quentin F
Bought by
Storkamp Tatum Marie and Storkamp Andrew
Current Estimated Value
Home Financials for this Owner
Home Financials are based on the most recent Mortgage that was taken out on this home.
Original Mortgage
$146,099
Interest Rate
4.13%
Mortgage Type
FHA
Purchase Details
Closed on
Jan 1, 2001
Sold by
Storkamp Andrew Jerel
Bought by
Carter Tatum Marie
Purchase Details
Closed on
Jul 25, 1997
Sold by
Hfs Mobility Services Inc
Bought by
Blackerby Quentin F and Blackerby Sharon L
Home Financials for this Owner
Home Financials are based on the most recent Mortgage that was taken out on this home.
Original Mortgage
$96,626
Interest Rate
7.6%
Mortgage Type
FHA
Create a Home Valuation Report for This Property
The Home Valuation Report is an in-depth analysis detailing your home's value as well as a comparison with similar homes in the area
Home Values in the Area
Average Home Value in this Area
Purchase History
| Date | Buyer | Sale Price | Title Company |
|---|---|---|---|
| Storkamp Tatum Marie | -- | Rtt | |
| Carter Tatum Marie | -- | None Available | |
| Blackerby Quentin F | -- | -- |
Source: Public Records
Mortgage History
| Date | Status | Borrower | Loan Amount |
|---|---|---|---|
| Previous Owner | Storkamp Tatum Marie | $146,099 | |
| Previous Owner | Blackerby Quentin F | $96,626 |
Source: Public Records
Tax History Compared to Growth
Tax History
| Year | Tax Paid | Tax Assessment Tax Assessment Total Assessment is a certain percentage of the fair market value that is determined by local assessors to be the total taxable value of land and additions on the property. | Land | Improvement |
|---|---|---|---|---|
| 2025 | $4,617 | $374,352 | $66,000 | $308,352 |
| 2024 | $6,033 | $352,743 | $0 | $0 |
| 2023 | $4,115 | $320,675 | $66,000 | $321,752 |
| 2022 | $5,558 | $289,046 | $66,000 | $231,495 |
| 2021 | $5,432 | $264,771 | $46,200 | $218,571 |
| 2020 | $4,977 | $238,881 | $46,200 | $192,681 |
| 2019 | $4,828 | $220,414 | $46,200 | $187,157 |
| 2018 | $4,445 | $200,376 | $46,200 | $171,654 |
| 2017 | $4,087 | $182,160 | $36,300 | $154,966 |
| 2016 | $3,716 | $165,600 | $36,300 | $135,660 |
| 2015 | $2,739 | $150,545 | $27,390 | $123,155 |
| 2014 | $2,739 | $141,897 | $27,390 | $114,507 |
| 2013 | -- | $141,340 | $27,390 | $113,950 |
Source: Public Records
Map
Nearby Homes
- 1841 Sandy Ridge Ct
- 3700 Cemetery Hill Rd
- 3719 Westminster Dr
- 1825 Addington Dr
- 1821 Addington Dr
- 3259 Northview
- 1901 Castille Dr
- 1716 Rosemeade Cir
- 1802 Kensington Dr
- 1804 Kensington Dr
- 1712 Rosemeade Cir
- 1825 Chamberlain Dr
- 1901 Addington Dr
- 1707 Dogwood Dr
- 1910 Rambling Ridge Ln
- 1816 Chamberlain Dr
- 1913 Rambling Ridge Ln
- 1711 Elizabeth Dr
- 1825 Arundel Dr
- 3221 Northview
- 1839 Sandy Ridge Ct
- 1835 Sandy Ridge Ct
- 1833 Sandy Ridge Ct
- 1831 Clear Creek Ln
- 1855 Sandy Ridge Ct
- 1857 Sandy Ridge Ct
- 1853 Sandy Ridge Ct
- 1819 Rock Springs Ct
- 1829 Clear Creek Ln
- 1843 Sandy Ridge Ct
- 1851 Sandy Ridge Ct
- 1859 Sandy Ridge Ct
- 1815 Rock Springs Ct
- 4141 Midway Rd
- 1827 Clear Creek Ln
- 1836 Clear Creek Ln
- 1845 Sandy Ridge Ct
- 1838 Clear Creek Ln
- 1834 Clear Creek Ln
- 1825 Clear Creek Ln