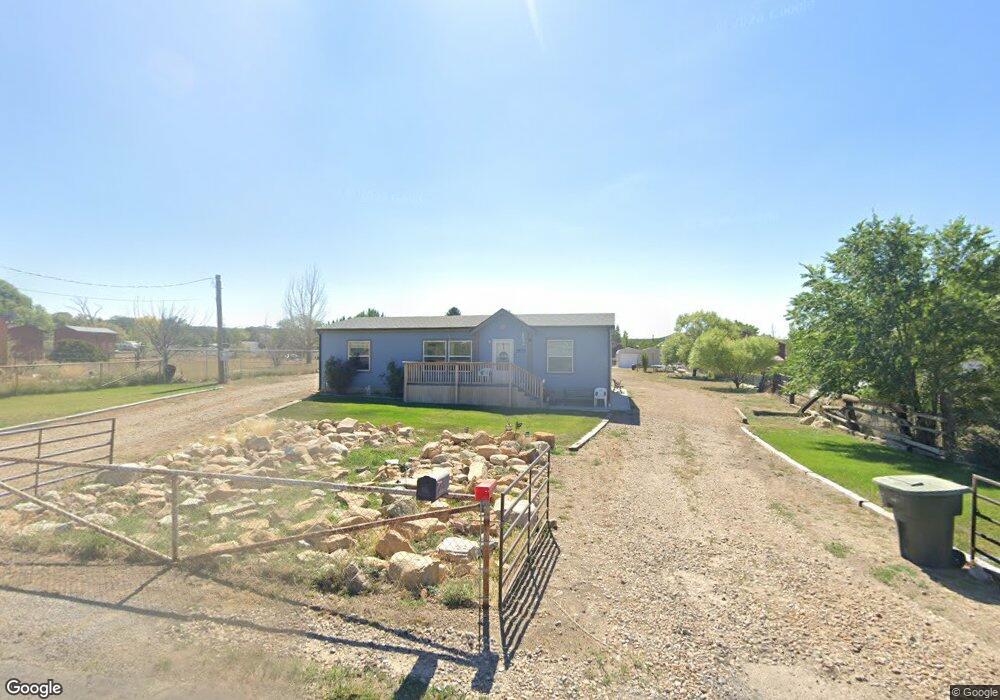
1837 W 4300 N Helper, UT 84526
Estimated Value: $238,000 - $368,000
--
Bed
--
Bath
1,316
Sq Ft
$238/Sq Ft
Est. Value
About This Home
This home is located at 1837 W 4300 N, Helper, UT 84526 and is currently estimated at $313,756, approximately $238 per square foot. 1837 W 4300 N is a home with nearby schools including Sally Mauro School, Helper Middle School, and Carbon High School.
Ownership History
Date
Name
Owned For
Owner Type
Purchase Details
Closed on
Jun 8, 2015
Sold by
Blackham Jaime
Bought by
Blackham Jaime and Blackham Elaine
Current Estimated Value
Home Financials for this Owner
Home Financials are based on the most recent Mortgage that was taken out on this home.
Original Mortgage
$90,000
Outstanding Balance
$33,956
Interest Rate
3.64%
Mortgage Type
New Conventional
Estimated Equity
$279,800
Purchase Details
Closed on
Jan 23, 2015
Sold by
Oldroyd Scott
Bought by
Blackham Jaime
Create a Home Valuation Report for This Property
The Home Valuation Report is an in-depth analysis detailing your home's value as well as a comparison with similar homes in the area
Home Values in the Area
Average Home Value in this Area
Purchase History
| Date | Buyer | Sale Price | Title Company |
|---|---|---|---|
| Blackham Jaime | -- | Professional Title Services | |
| Blackham Jaime | -- | None Available |
Source: Public Records
Mortgage History
| Date | Status | Borrower | Loan Amount |
|---|---|---|---|
| Open | Blackham Jaime | $90,000 |
Source: Public Records
Tax History Compared to Growth
Tax History
| Year | Tax Paid | Tax Assessment Tax Assessment Total Assessment is a certain percentage of the fair market value that is determined by local assessors to be the total taxable value of land and additions on the property. | Land | Improvement |
|---|---|---|---|---|
| 2024 | $1,801 | $141,456 | $47,278 | $94,178 |
| 2023 | $1,262 | $104,985 | $30,420 | $74,565 |
| 2022 | $1,362 | $100,726 | $26,161 | $74,565 |
| 2021 | $1,259 | $147,693 | $38,360 | $109,333 |
| 2020 | $1,124 | $67,351 | $0 | $0 |
| 2019 | $838 | $61,386 | $0 | $0 |
| 2018 | $815 | $61,386 | $0 | $0 |
| 2017 | $818 | $62,511 | $0 | $0 |
| 2016 | $732 | $62,511 | $0 | $0 |
| 2015 | $732 | $62,511 | $0 | $0 |
| 2014 | $395 | $34,250 | $0 | $0 |
| 2013 | $471 | $40,500 | $0 | $0 |
Source: Public Records
Map
Nearby Homes