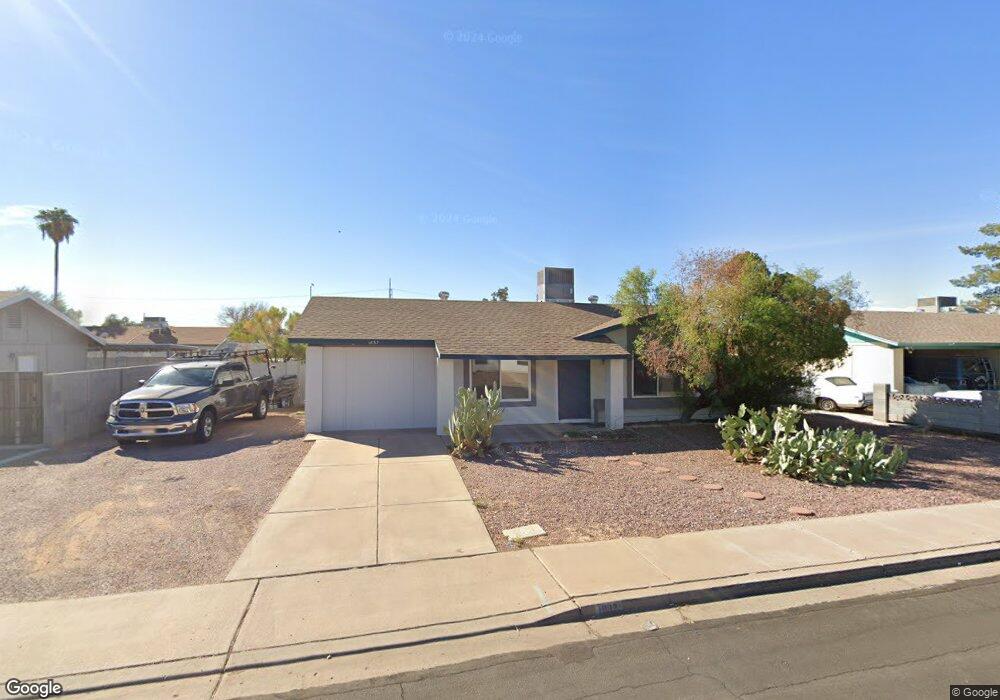
1837 W Portobello Ave Mesa, AZ 85202
Dobson NeighborhoodEstimated Value: $322,670 - $365,000
--
Bed
1
Bath
912
Sq Ft
$380/Sq Ft
Est. Value
About This Home
This home is located at 1837 W Portobello Ave, Mesa, AZ 85202 and is currently estimated at $346,168, approximately $379 per square foot. 1837 W Portobello Ave is a home located in Maricopa County with nearby schools including Franklin at Brimhall Elementary School, Summit Academy Elementary, and Franklin Accelerated Academy Jordan Campus.
Ownership History
Date
Name
Owned For
Owner Type
Purchase Details
Closed on
Oct 24, 2005
Sold by
Torres Michael R
Bought by
Torres Michael R and Torres Dawn P
Current Estimated Value
Home Financials for this Owner
Home Financials are based on the most recent Mortgage that was taken out on this home.
Original Mortgage
$166,460
Outstanding Balance
$88,647
Interest Rate
5.68%
Mortgage Type
FHA
Estimated Equity
$257,521
Purchase Details
Closed on
Nov 26, 2001
Sold by
Reeves Troy
Bought by
Torres Michael R and Torres Dawn P
Home Financials for this Owner
Home Financials are based on the most recent Mortgage that was taken out on this home.
Original Mortgage
$104,657
Interest Rate
6.63%
Mortgage Type
FHA
Purchase Details
Closed on
May 14, 1997
Sold by
Reeves Tami S
Bought by
Reeves Troy
Create a Home Valuation Report for This Property
The Home Valuation Report is an in-depth analysis detailing your home's value as well as a comparison with similar homes in the area
Home Values in the Area
Average Home Value in this Area
Purchase History
| Date | Buyer | Sale Price | Title Company |
|---|---|---|---|
| Torres Michael R | -- | Stewart Title & Trust Of Pho | |
| Torres Michael R | -- | -- | |
| Torres Michael R | $106,300 | Chicago Title Insurance Co | |
| Reeves Troy | -- | Chicago Title Insurance Co | |
| Reeves Troy | $60,939 | Chicago Title Insurance Co |
Source: Public Records
Mortgage History
| Date | Status | Borrower | Loan Amount |
|---|---|---|---|
| Open | Torres Michael R | $166,460 | |
| Closed | Torres Michael R | $104,657 |
Source: Public Records
Tax History Compared to Growth
Tax History
| Year | Tax Paid | Tax Assessment Tax Assessment Total Assessment is a certain percentage of the fair market value that is determined by local assessors to be the total taxable value of land and additions on the property. | Land | Improvement |
|---|---|---|---|---|
| 2025 | $923 | $11,119 | -- | -- |
| 2024 | $933 | $10,590 | -- | -- |
| 2023 | $933 | $27,280 | $5,450 | $21,830 |
| 2022 | $913 | $19,900 | $3,980 | $15,920 |
| 2021 | $938 | $18,300 | $3,660 | $14,640 |
| 2020 | $925 | $15,800 | $3,160 | $12,640 |
| 2019 | $857 | $13,820 | $2,760 | $11,060 |
| 2018 | $819 | $12,600 | $2,520 | $10,080 |
| 2017 | $793 | $11,100 | $2,220 | $8,880 |
| 2016 | $779 | $9,480 | $1,890 | $7,590 |
| 2015 | $735 | $9,110 | $1,820 | $7,290 |
Source: Public Records
Map
Nearby Homes
- 1853 W Plata Ave
- 2958 S El Paradiso
- 2937 S Pennington
- 1910 W Onza Ave
- 2030 W Portobello Ave
- 2014 W Summit Place
- 2722 S Pennington
- 2043 W Nopal Ave
- 1555 W Naranja Ave
- 2719 S Santa Barbara
- 1531 W Naranja Ave
- 2334 W Peralta Ave
- 1639 W Nido Ave
- 2637 S El Paradiso
- 2741 S Brooks --
- 2309 W Naranja Ave
- 2727 S El Marino
- 1351 W Plata Ave
- 1337 W Pampa Ave
- 2554 S Salida Del Sol
- 1831 W Portobello Ave
- 1845 W Portobello Ave
- 1838 W Pampa Ave
- 1846 W Pampa Ave
- 1832 W Pampa Ave
- 1838 W Portobello Ave
- 1851 W Portobello Ave
- 1823 W Portobello Ave
- 1832 W Portobello Ave
- 1846 W Portobello Ave
- 1852 W Pampa Ave
- 1824 W Pampa Ave
- 1824 W Portobello Ave
- 1852 W Portobello Ave
- 1817 W Portobello Ave
- 1859 W Portobello Ave
- 1835 W Pecos Ave
- 1858 W Pampa Ave
- 1812 W Pampa Ave
- 1829 W Pecos Ave