Estimated Value: $52,000 - $100,000
2
Beds
1
Bath
833
Sq Ft
$90/Sq Ft
Est. Value
About This Home
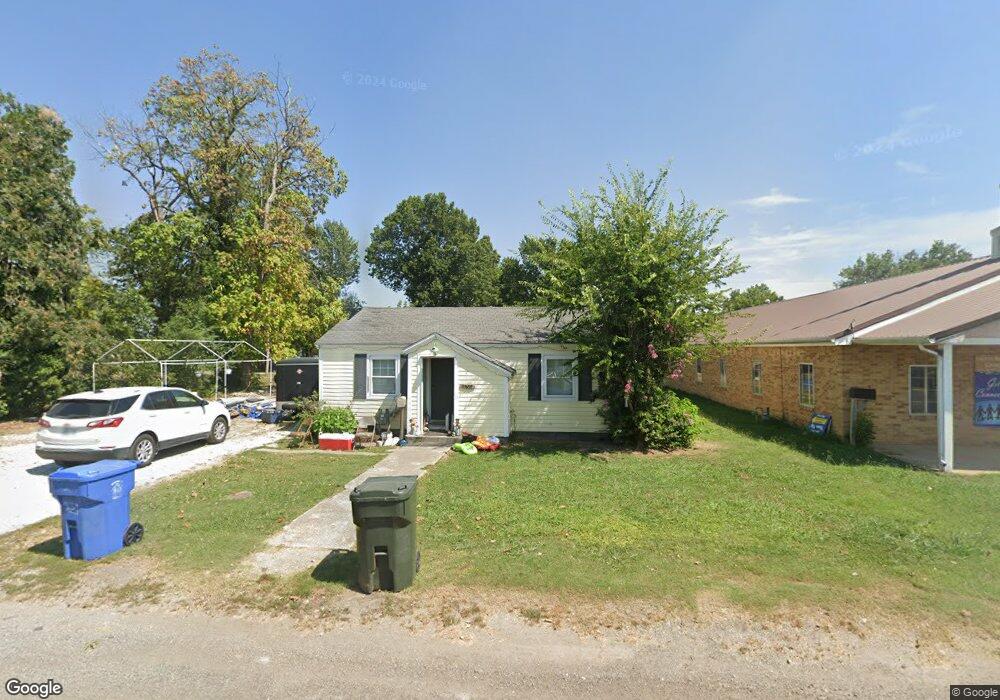
This home is located at 1838 A St NE, Miami, OK 74354 and is currently estimated at $75,011, approximately $90 per square foot. 1838 A St NE is a home located in Ottawa County with nearby schools including Miami High School and Mt. Olive Lutheran School.
Ownership History
Date
Name
Owned For
Owner Type
Purchase Details
Closed on
Feb 17, 2010
Sold by
Freeze Linda K
Bought by
Nehring George and Nehring Earldine B
Current Estimated Value
Purchase Details
Closed on
Feb 1, 2010
Sold by
Freeze Linda K
Bought by
Nehring George and Nehring Eardline B
Purchase Details
Closed on
Jul 10, 2002
Bought by
Freeze Linda K
Purchase Details
Closed on
Apr 18, 2002
Bought by
Ramey-Nehring E Etal
Purchase Details
Closed on
Aug 19, 1999
Sold by
Nohring Henry G and Nohring Earldine B
Bought by
Nehring Rex E
Create a Home Valuation Report for This Property
The Home Valuation Report is an in-depth analysis detailing your home's value as well as a comparison with similar homes in the area
Home Values in the Area
Average Home Value in this Area
Purchase History
| Date | Buyer | Sale Price | Title Company |
|---|---|---|---|
| Nehring George | -- | None Available | |
| Nehring George | -- | None Available | |
| Freeze Linda K | -- | -- | |
| Ramey-Nehring E Etal | -- | -- | |
| Nehring Rex E | -- | None Available |
Source: Public Records
Tax History Compared to Growth
Tax History
| Year | Tax Paid | Tax Assessment Tax Assessment Total Assessment is a certain percentage of the fair market value that is determined by local assessors to be the total taxable value of land and additions on the property. | Land | Improvement |
|---|---|---|---|---|
| 2025 | $244 | $2,654 | $486 | $2,168 |
| 2024 | $244 | $2,528 | $463 | $2,065 |
| 2023 | $244 | $2,407 | $456 | $1,951 |
| 2022 | $212 | $2,293 | $451 | $1,842 |
| 2021 | $206 | $2,183 | $445 | $1,738 |
| 2020 | $198 | $2,079 | $440 | $1,639 |
| 2019 | $163 | $1,981 | $434 | $1,547 |
| 2018 | $156 | $1,887 | $429 | $1,458 |
| 2017 | $151 | $1,797 | $424 | $1,373 |
| 2016 | $138 | $1,712 | $419 | $1,293 |
| 2015 | $148 | $1,667 | $658 | $1,009 |
| 2014 | $134 | $1,630 | $399 | $1,231 |
Source: Public Records
Map
Nearby Homes