Estimated Value: $17,000 - $120,000
2
Beds
1
Bath
856
Sq Ft
$80/Sq Ft
Est. Value
About This Home
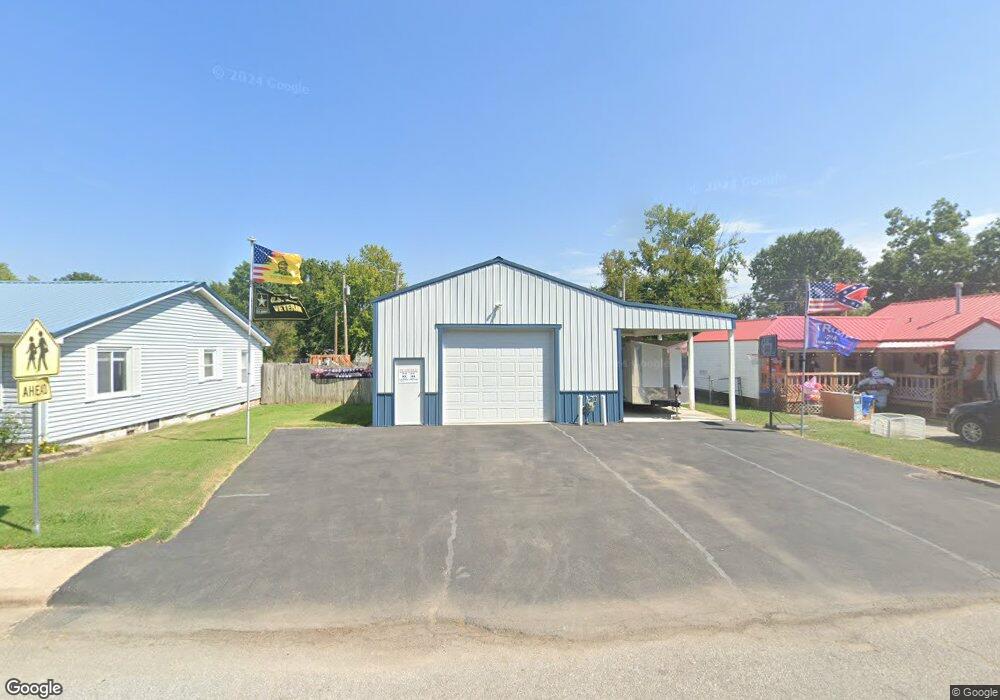
This home is located at 1838 B St NE, Miami, OK 74354 and is currently estimated at $68,500, approximately $80 per square foot. 1838 B St NE is a home located in Ottawa County with nearby schools including Miami High School and Mt. Olive Lutheran School.
Ownership History
Date
Name
Owned For
Owner Type
Purchase Details
Closed on
Jan 31, 2006
Sold by
Vaughan Charles and Vaughan Teressa
Bought by
Vaughan Charles T and Vaughan Teressa
Current Estimated Value
Home Financials for this Owner
Home Financials are based on the most recent Mortgage that was taken out on this home.
Original Mortgage
$34,738
Outstanding Balance
$19,468
Interest Rate
6.22%
Mortgage Type
Unknown
Estimated Equity
$49,032
Purchase Details
Closed on
Jul 30, 2001
Bought by
Vaughan Charles T and Vaughan Teressa
Purchase Details
Closed on
Dec 23, 1996
Bought by
Vaughan Ruth and Vaughan Charles
Purchase Details
Closed on
Feb 25, 1994
Bought by
Arizpe Jose J
Create a Home Valuation Report for This Property
The Home Valuation Report is an in-depth analysis detailing your home's value as well as a comparison with similar homes in the area
Home Values in the Area
Average Home Value in this Area
Purchase History
| Date | Buyer | Sale Price | Title Company |
|---|---|---|---|
| Vaughan Charles T | -- | None Available | |
| Vaughan Charles T | -- | -- | |
| Vaughan Ruth | $9,000 | -- | |
| Arizpe Jose J | $7,000 | -- |
Source: Public Records
Mortgage History
| Date | Status | Borrower | Loan Amount |
|---|---|---|---|
| Open | Vaughan Charles T | $34,738 |
Source: Public Records
Tax History Compared to Growth
Tax History
| Year | Tax Paid | Tax Assessment Tax Assessment Total Assessment is a certain percentage of the fair market value that is determined by local assessors to be the total taxable value of land and additions on the property. | Land | Improvement |
|---|---|---|---|---|
| 2025 | $144 | $1,564 | $570 | $994 |
| 2024 | $144 | $1,490 | $550 | $940 |
| 2023 | $144 | $1,418 | $539 | $879 |
| 2022 | $125 | $1,351 | $538 | $813 |
| 2021 | $122 | $1,287 | $537 | $750 |
| 2020 | $117 | $1,225 | $536 | $689 |
| 2019 | $96 | $1,168 | $536 | $632 |
| 2018 | $97 | $1,168 | $536 | $632 |
| 2017 | $98 | $1,168 | $536 | $632 |
| 2016 | $96 | $1,196 | $536 | $660 |
| 2015 | $89 | $1,001 | $376 | $625 |
| 2014 | $100 | $1,216 | $195 | $1,021 |
Source: Public Records
Map
Nearby Homes