1838 Bashan Dr Unit 75D Columbus, OH 43228
Estimated Value: $176,472 - $187,000
2
Beds
2
Baths
1,248
Sq Ft
$147/Sq Ft
Est. Value
About This Home
This home is located at 1838 Bashan Dr Unit 75D, Columbus, OH 43228 and is currently estimated at $183,618, approximately $147 per square foot. 1838 Bashan Dr Unit 75D is a home located in Franklin County with nearby schools including Bolton Crossing Elementary School, Holt Crossing Intermediate School, and Pleasant View Middle School.
Ownership History
Date
Name
Owned For
Owner Type
Purchase Details
Closed on
Feb 27, 2012
Sold by
Friend Michael G
Bought by
Schultz Toni M
Current Estimated Value
Home Financials for this Owner
Home Financials are based on the most recent Mortgage that was taken out on this home.
Original Mortgage
$67,250
Outstanding Balance
$45,836
Interest Rate
4.01%
Mortgage Type
FHA
Estimated Equity
$137,782
Purchase Details
Closed on
Aug 24, 2011
Sold by
Secretary Of Housing & Urban Development
Bought by
Friend Michael G
Purchase Details
Closed on
Aug 4, 2010
Sold by
Thompson Trina M
Bought by
Wells Fargo Bank Na
Purchase Details
Closed on
Jun 7, 2010
Sold by
Wells Fargo Bank Na
Bought by
Secretary Of Housing & Urban Development
Purchase Details
Closed on
Mar 19, 2001
Sold by
The Qualstan Corp
Bought by
Thompson Trina M
Home Financials for this Owner
Home Financials are based on the most recent Mortgage that was taken out on this home.
Original Mortgage
$83,087
Interest Rate
7.03%
Mortgage Type
FHA
Create a Home Valuation Report for This Property
The Home Valuation Report is an in-depth analysis detailing your home's value as well as a comparison with similar homes in the area
Purchase History
| Date | Buyer | Sale Price | Title Company |
|---|---|---|---|
| Schultz Toni M | $69,000 | Bxvalmer Land | |
| Friend Michael G | $30,000 | Valmer Land | |
| Wells Fargo Bank Na | $44,000 | Attorney | |
| Secretary Of Housing & Urban Development | -- | None Available | |
| Thompson Trina M | $85,000 | Lawyers Title |
Source: Public Records
Mortgage History
| Date | Status | Borrower | Loan Amount |
|---|---|---|---|
| Open | Schultz Toni M | $67,250 | |
| Previous Owner | Thompson Trina M | $83,087 |
Source: Public Records
Tax History
| Year | Tax Paid | Tax Assessment Tax Assessment Total Assessment is a certain percentage of the fair market value that is determined by local assessors to be the total taxable value of land and additions on the property. | Land | Improvement |
|---|---|---|---|---|
| 2025 | $1,702 | $46,690 | $10,500 | $36,190 |
| 2024 | $1,702 | $46,690 | $10,500 | $36,190 |
| 2023 | $1,672 | $46,690 | $10,500 | $36,190 |
| 2022 | $1,604 | $32,870 | $4,550 | $28,320 |
| 2021 | $1,636 | $32,870 | $4,550 | $28,320 |
| 2020 | $1,627 | $32,870 | $4,550 | $28,320 |
| 2019 | $1,418 | $25,270 | $3,500 | $21,770 |
| 2018 | $1,281 | $25,270 | $3,500 | $21,770 |
| 2017 | $1,278 | $25,270 | $3,500 | $21,770 |
| 2016 | $1,152 | $19,040 | $2,870 | $16,170 |
| 2015 | $1,152 | $19,040 | $2,870 | $16,170 |
| 2014 | $1,153 | $19,040 | $2,870 | $16,170 |
| 2013 | $672 | $22,365 | $3,360 | $19,005 |
Source: Public Records
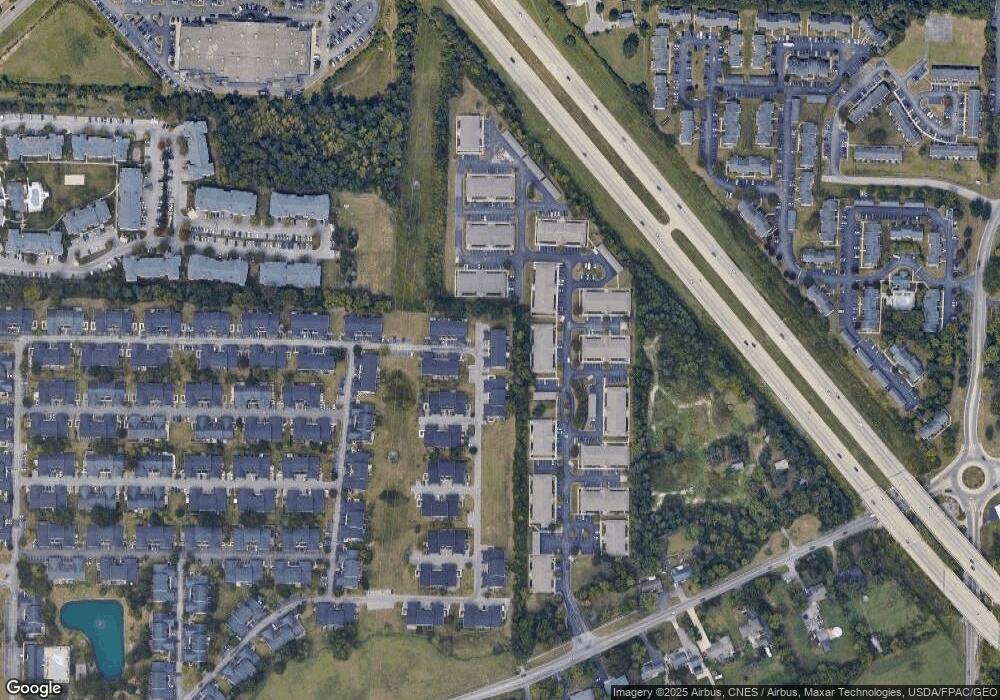
Map
Nearby Homes
- 1842 Bashan Dr Unit 75F
- 4633 Parrau Dr Unit 70F
- 4644 Hobson Dr Unit 13D
- 1981 Hoadley Dr Unit 10A
- 4701 Cadmus Dr Unit 31E
- 2073 Santuomo Ave
- 4704 Hobson Dr Unit 4A
- 4732 Lesbrook Dr
- 2120 Sunrush Ct
- 4655 Parkwick Dr
- 1925 Fortstone Ln Unit 1925
- 4315 Shady Meadows Dr
- 1870 Berrancher Dr Unit 1870
- 1800 Georgesville Square Dr
- 1997 Berrancher Dr Unit 1997
- 4320 Grouse Ct
- 1710 Carrigallen Ln
- 4474 Greystone Village Dr Unit 5D
- 2147 Exemplar Ct
- 4531 White Leaf Way
- 1836 Bashan Dr Unit 75C
- 1834 Bashan Dr Unit 75B
- 1832 Bashan Dr Unit 75A
- 1840 Bashan Dr Unit 75E
- 1840 Bashan Dr Unit C
- 4572 Parrau Dr Unit 74G
- 4574 Parrau Dr Unit 74F
- 4574 Parrau Dr Unit F
- 1852 Bashan Dr Unit 76A
- 1854 Bashan Dr Unit 76B
- 4577 Parrau Dr Unit 73A
- 4579 Parrau Dr Unit 73B
- 4576 Parrau Dr Unit 74E
- 1844 Bashan Dr Unit 75G
- 4581 Parrau Dr Unit 73C
- 4578 Parrau Dr Unit 74D
- 4580 Parrau Dr Unit 74C
- 4583 Parrau Dr Unit 73D
- 4584 Parrau Dr Unit 74A
- 4582 Parrau Dr Unit 74B
Your Personal Tour Guide
Ask me questions while you tour the home.