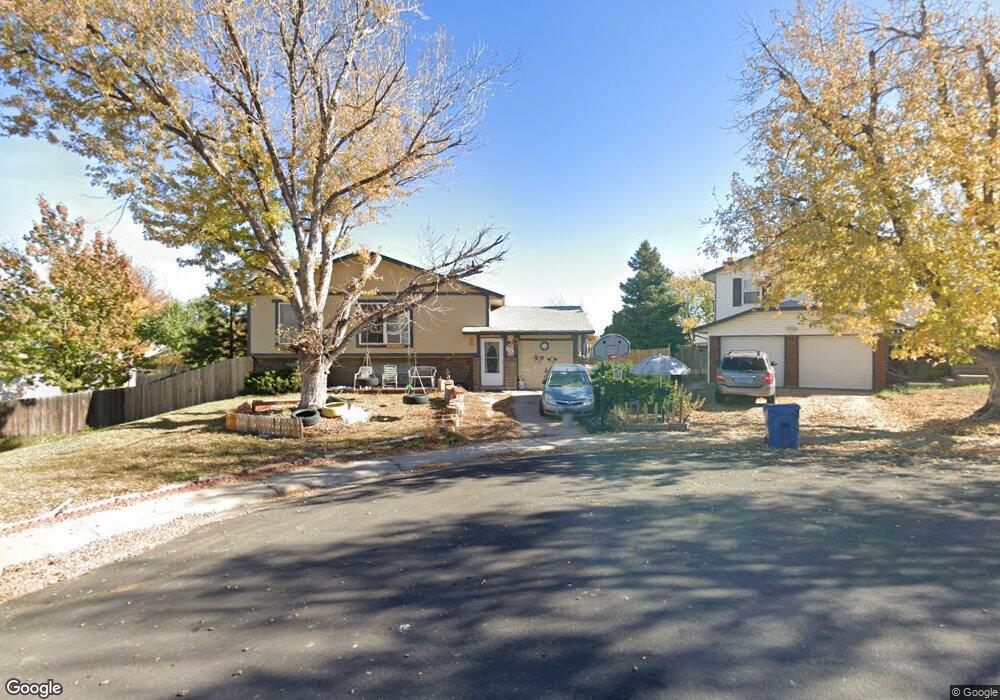
1838 Kittredge St Aurora, CO 80011
Norfolk Glen NeighborhoodEstimated Value: $398,225 - $450,000
4
Beds
1
Bath
1,820
Sq Ft
$232/Sq Ft
Est. Value
About This Home
This home is located at 1838 Kittredge St, Aurora, CO 80011 and is currently estimated at $421,556, approximately $231 per square foot. 1838 Kittredge St is a home located in Adams County with nearby schools including Altura Elementary School, Piute Middle School, and East Middle School.
Ownership History
Date
Name
Owned For
Owner Type
Purchase Details
Closed on
Dec 10, 2014
Sold by
Hoefer David L
Bought by
The David L Hoefer Trust
Current Estimated Value
Purchase Details
Closed on
Oct 15, 2001
Sold by
Seymour Kris and Seymour Katie
Bought by
Hoefer David L
Home Financials for this Owner
Home Financials are based on the most recent Mortgage that was taken out on this home.
Original Mortgage
$110,000
Interest Rate
6.85%
Mortgage Type
Balloon
Purchase Details
Closed on
Jul 30, 1999
Sold by
Bandy Mickey D and Bandy Amanda S
Bought by
Seymour Kris and Seymour Katie
Home Financials for this Owner
Home Financials are based on the most recent Mortgage that was taken out on this home.
Original Mortgage
$124,336
Interest Rate
7.63%
Mortgage Type
FHA
Purchase Details
Closed on
Jan 30, 1997
Sold by
Buhlke Larry D and Buhlke Judith A
Bought by
Bandy Mickey D and Bandy Amanda S
Home Financials for this Owner
Home Financials are based on the most recent Mortgage that was taken out on this home.
Original Mortgage
$80,800
Interest Rate
10%
Purchase Details
Closed on
Jul 7, 1992
Create a Home Valuation Report for This Property
The Home Valuation Report is an in-depth analysis detailing your home's value as well as a comparison with similar homes in the area
Home Values in the Area
Average Home Value in this Area
Purchase History
| Date | Buyer | Sale Price | Title Company |
|---|---|---|---|
| The David L Hoefer Trust | -- | None Available | |
| Hoefer David L | $147,000 | Land Title Guarantee Company | |
| Seymour Kris | $128,000 | -- | |
| Bandy Mickey D | $101,000 | -- | |
| -- | $67,900 | -- |
Source: Public Records
Mortgage History
| Date | Status | Borrower | Loan Amount |
|---|---|---|---|
| Closed | Hoefer David L | $110,000 | |
| Previous Owner | Seymour Kris | $124,336 | |
| Previous Owner | Bandy Mickey D | $80,800 |
Source: Public Records
Tax History Compared to Growth
Tax History
| Year | Tax Paid | Tax Assessment Tax Assessment Total Assessment is a certain percentage of the fair market value that is determined by local assessors to be the total taxable value of land and additions on the property. | Land | Improvement |
|---|---|---|---|---|
| 2024 | $2,604 | $25,370 | $5,060 | $20,310 |
| 2023 | $2,645 | $28,550 | $5,010 | $23,540 |
| 2022 | $2,224 | $19,570 | $5,140 | $14,430 |
| 2021 | $2,317 | $19,570 | $5,140 | $14,430 |
| 2020 | $2,394 | $20,290 | $5,290 | $15,000 |
| 2019 | $2,390 | $20,290 | $5,290 | $15,000 |
| 2018 | $1,979 | $16,730 | $3,890 | $12,840 |
| 2017 | $1,758 | $16,730 | $3,890 | $12,840 |
| 2016 | $1,319 | $12,450 | $2,630 | $9,820 |
| 2015 | $1,278 | $12,450 | $2,630 | $9,820 |
| 2014 | $1,130 | $10,840 | $2,070 | $8,770 |
Source: Public Records
Map
Nearby Homes
- 16211 E 17th Place Unit C
- 16357 E 18th Place
- 16485 E 17th Place Unit D
- 15680 E Colfax Ave Unit F
- 15747 E 13th Place Unit B22
- 15775 E 13th Place
- 15737 E 13th Place
- 15771 E 13th Place Unit C34
- 15233 E 16th Dr
- 1435 Norfolk St
- 15703 E 13th Place Unit 1A
- 1984 Buckley Way Unit 209
- 1686 Eisenhower Way Unit 170
- 15195 E 16th Place Unit 104
- 1666 Eisenhower Way Unit 166
- 1893 Eisenhower Way
- 1974 Van Buren Way Unit 278
- 1966 Van Buren Way Unit 282
- 1910 Altura Blvd
- 1960 Van Buren Way Unit 285
- 16010 E 18th Place
- 1828 Kittredge St
- 16060 E 18th Place
- 1818 Kittredge St
- 1837 Kittredge St
- 1817 Kittredge St
- 1847 Kittredge St
- 1827 Kittredge St
- 16080 E 18th Place
- 1785 Kittredge Ct
- 1775 Kittredge Ct
- 16011 E 18th Place
- 16031 E 18th Place
- 16051 E 18th Place
- 15999 E 18th Place
- 16102 E 18th Place
- 15978 E 18th Place
- 16071 E 18th Place
- 1786 Kittredge Ct
- 15989 E 18th Place