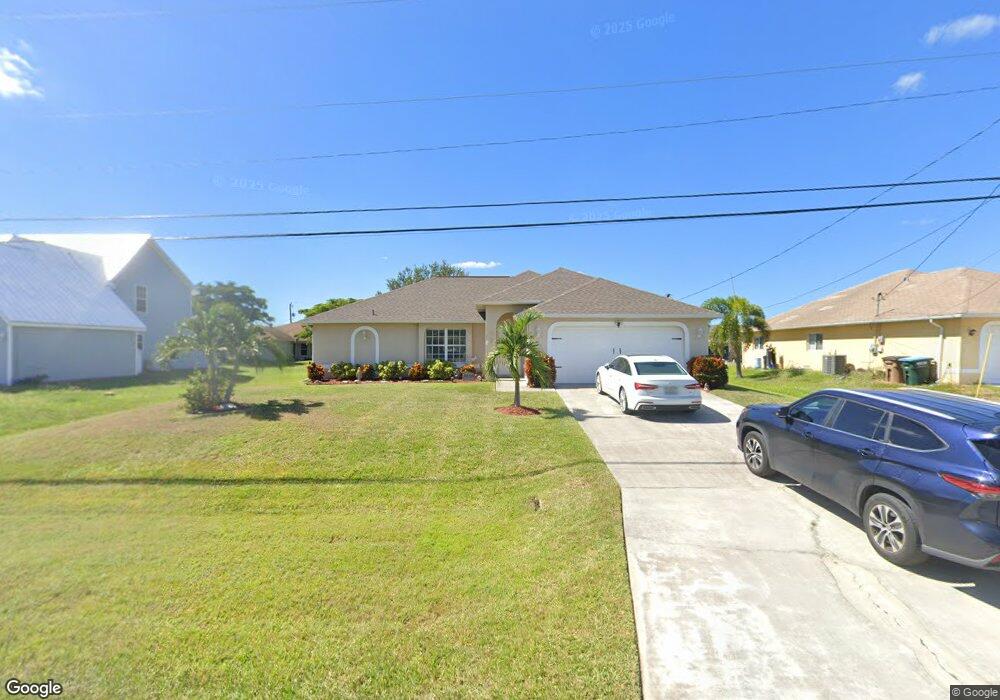
1838 NW 5th Place Cape Coral, FL 33993
Mariner NeighborhoodEstimated Value: $283,413 - $349,000
4
Beds
2
Baths
1,712
Sq Ft
$190/Sq Ft
Est. Value
About This Home
This home is located at 1838 NW 5th Place, Cape Coral, FL 33993 and is currently estimated at $325,853, approximately $190 per square foot. 1838 NW 5th Place is a home located in Lee County with nearby schools including Dr. Carrie D. Robinson Littleton Elementary School, Caloosa Elementary School, and Tropic Isles Elementary School.
Ownership History
Date
Name
Owned For
Owner Type
Purchase Details
Closed on
Sep 15, 2021
Sold by
Borders John L and Borders Barbara J
Bought by
Borders John Lawrence and Borders Barbara Jean
Current Estimated Value
Purchase Details
Closed on
Jul 8, 2011
Sold by
Pelland John A
Bought by
Borders John L and Borders Barbara J
Purchase Details
Closed on
Dec 3, 2010
Sold by
Hsbc Bank Usa
Bought by
Pelland John A
Purchase Details
Closed on
Sep 28, 2010
Sold by
Carleton Kathleen and Carleton Kathleen P
Bought by
Hsbc Bank Usa
Purchase Details
Closed on
Dec 21, 2004
Sold by
Lehner Monique
Bought by
Carleton Kathleen
Home Financials for this Owner
Home Financials are based on the most recent Mortgage that was taken out on this home.
Original Mortgage
$200,425
Interest Rate
5.71%
Mortgage Type
Unknown
Create a Home Valuation Report for This Property
The Home Valuation Report is an in-depth analysis detailing your home's value as well as a comparison with similar homes in the area
Home Values in the Area
Average Home Value in this Area
Purchase History
| Date | Buyer | Sale Price | Title Company |
|---|---|---|---|
| Borders John Lawrence | -- | Accommodation | |
| Borders John L | $95,500 | Realty Title Solutions Lllp | |
| Pelland John A | $45,000 | Servicelink | |
| Hsbc Bank Usa | $51,100 | None Available | |
| Carleton Kathleen | $45,000 | Select Title Guaranty Agency |
Source: Public Records
Mortgage History
| Date | Status | Borrower | Loan Amount |
|---|---|---|---|
| Previous Owner | Carleton Kathleen | $200,425 |
Source: Public Records
Tax History Compared to Growth
Tax History
| Year | Tax Paid | Tax Assessment Tax Assessment Total Assessment is a certain percentage of the fair market value that is determined by local assessors to be the total taxable value of land and additions on the property. | Land | Improvement |
|---|---|---|---|---|
| 2025 | $2,955 | $178,136 | -- | -- |
| 2024 | $2,822 | $173,116 | -- | -- |
| 2023 | $2,822 | $168,074 | $0 | $0 |
| 2022 | $2,565 | $160,464 | $0 | $0 |
| 2021 | $2,579 | $165,575 | $9,000 | $156,575 |
| 2020 | $2,598 | $153,639 | $0 | $0 |
| 2019 | $2,513 | $150,185 | $10,500 | $139,685 |
| 2018 | $2,518 | $148,406 | $0 | $0 |
| 2017 | $2,497 | $145,354 | $6,800 | $138,554 |
| 2016 | $2,779 | $128,619 | $6,800 | $121,819 |
| 2015 | $2,566 | $112,798 | $6,300 | $106,498 |
| 2014 | $2,393 | $105,799 | $5,640 | $100,159 |
| 2013 | -- | $90,796 | $3,900 | $86,896 |
Source: Public Records
Map
Nearby Homes
- 1834 NW 5th Place
- 501 NW 19th Terrace
- 419 NW 19th St
- 516 NW 20th St
- 1809 NW 6th Ave
- 504 NW 20th St
- 522 NW 20th St
- 426 NW 18th Terrace
- 409 NW 19th Terrace
- 1733 NW 6th Ave
- 1733 NW 6th Place
- 402 NW 18th Terrace
- 519 NW 20th Terrace
- 1825 NW 7th Ave
- 1821 NW 7th Ave
- 1734 NW 6th Place
- 322 NW 20th St
- 522 NW 21st St
- 402 NW 18th St
- 1805 NW 7th Ave
- 1840 NW 5th Place
- 1842 NW 5th Place
- 1827 NW 6th Ave
- 1835 NW 6th Ave
- 1830 NW 5th Place
- 1821 NW 5th Place Unit 39
- 3052 NW 5th Place Unit 40
- 1821 NW 5th Place
- 1800 NW 5th Place
- 1809 NW 5th Place
- 0 NW 5th Place Unit 60053067
- 0 NW 5th Place Unit 80085280
- 2613 NW 5th Place
- 0 NW 5th Place Unit 30170198
- 2935 NW 5th Place
- 0 NW 5th Place
- 1714 NW 5th Place
- 1813 NW 5th Place
- 3208 NW 5th Place
- 2809 NW 5th Place