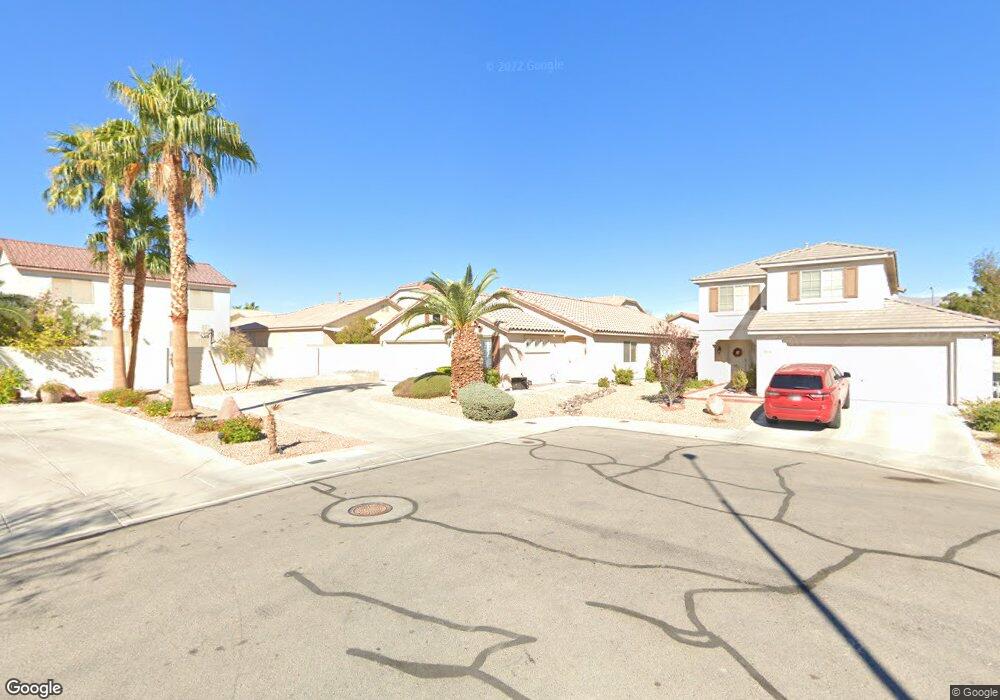
1838 Running Fawn Ct North Las Vegas, NV 89031
Craig Ranch NeighborhoodEstimated Value: $407,310 - $439,000
4
Beds
2
Baths
1,743
Sq Ft
$243/Sq Ft
Est. Value
About This Home
This home is located at 1838 Running Fawn Ct, North Las Vegas, NV 89031 and is currently estimated at $423,578, approximately $243 per square foot. 1838 Running Fawn Ct is a home located in Clark County with nearby schools including Eva G. Simmons Elementary School, Brian & Teri Cram Middle School, and Legacy High School.
Ownership History
Date
Name
Owned For
Owner Type
Purchase Details
Closed on
Nov 23, 2009
Sold by
The Bank Of New York Mellon
Bought by
Copeland Carry R and Copeland Sherry L
Current Estimated Value
Home Financials for this Owner
Home Financials are based on the most recent Mortgage that was taken out on this home.
Original Mortgage
$95,600
Outstanding Balance
$62,135
Interest Rate
4.91%
Mortgage Type
New Conventional
Estimated Equity
$361,443
Purchase Details
Closed on
Sep 19, 2009
Sold by
Jackson Timothy and Nelson Janet
Bought by
The Bank Of New York Mellon and The Bank Of New York
Purchase Details
Closed on
Oct 4, 2004
Sold by
Forsha Donald W and Forsha Sandra Z
Bought by
Jackson Timothy and Nelson Janet
Home Financials for this Owner
Home Financials are based on the most recent Mortgage that was taken out on this home.
Original Mortgage
$239,999
Interest Rate
7%
Mortgage Type
Unknown
Purchase Details
Closed on
Oct 11, 2000
Sold by
Pardee Construction Company Of Nevada
Bought by
Forsha Donald W and Forsha Sandra Z
Home Financials for this Owner
Home Financials are based on the most recent Mortgage that was taken out on this home.
Original Mortgage
$138,500
Interest Rate
7.08%
Mortgage Type
VA
Create a Home Valuation Report for This Property
The Home Valuation Report is an in-depth analysis detailing your home's value as well as a comparison with similar homes in the area
Home Values in the Area
Average Home Value in this Area
Purchase History
| Date | Buyer | Sale Price | Title Company |
|---|---|---|---|
| Copeland Carry R | $127,500 | First American Title Paseo | |
| The Bank Of New York Mellon | $94,400 | Fidelity National Default So | |
| Jackson Timothy | $299,999 | Equity Title Of Nevada | |
| Forsha Donald W | $135,802 | National Title Company |
Source: Public Records
Mortgage History
| Date | Status | Borrower | Loan Amount |
|---|---|---|---|
| Open | Copeland Carry R | $95,600 | |
| Previous Owner | Jackson Timothy | $239,999 | |
| Previous Owner | Forsha Donald W | $138,500 | |
| Closed | Jackson Timothy | $59,999 |
Source: Public Records
Tax History Compared to Growth
Tax History
| Year | Tax Paid | Tax Assessment Tax Assessment Total Assessment is a certain percentage of the fair market value that is determined by local assessors to be the total taxable value of land and additions on the property. | Land | Improvement |
|---|---|---|---|---|
| 2025 | $1,632 | $100,957 | $31,150 | $69,807 |
| 2024 | $1,585 | $100,957 | $31,150 | $69,807 |
| 2023 | $1,585 | $97,212 | $31,150 | $66,062 |
| 2022 | $1,539 | $85,490 | $25,200 | $60,290 |
| 2021 | $1,494 | $80,436 | $23,100 | $57,336 |
| 2020 | $1,448 | $79,640 | $22,750 | $56,890 |
| 2019 | $1,406 | $75,599 | $19,600 | $55,999 |
| 2018 | $1,381 | $68,895 | $15,050 | $53,845 |
| 2017 | $2,112 | $62,950 | $12,250 | $50,700 |
| 2016 | $1,293 | $55,636 | $8,750 | $46,886 |
| 2015 | $1,290 | $41,433 | $7,000 | $34,433 |
| 2014 | $1,250 | $36,146 | $7,000 | $29,146 |
Source: Public Records
Map
Nearby Homes
- 5738 Bear Springs St
- 1901 Desert Sage Ave
- 5823 Rose Sage St
- 5655 Indian Springs St
- 5624 Deer Run Ct
- 5904 Arrowleaf St
- 5634 Water Garden St
- 2102 Stone Well Rd
- 2116 W El Campo Grande Ave
- 2212 Maui Surf Ave
- 1642 Heather Ridge Rd
- 5816 Elphin Ct
- 5871 Prairie Ridge Cir
- 5623 Weeping Wall St
- 1813 Arch Stone Ave
- 6056 Fort Wayne Ct
- 2024 Fountain Valley Way
- 1415 Black Hills Way
- 2214 Akamine Ave
- 1515 Fort Dix Cir
- 1834 Running Fawn Ct
- 5736 Deer Brush Ct
- 1830 Running Fawn Ct
- 5732 Deer Brush Ct
- 5740 Deer Brush Ct
- 1903 Giant Pine Ave
- 1835 Giant Pine Ave
- 1907 Giant Pine Ave
- 5728 Deer Brush Ct
- 1841 Running Fawn Ct
- 1826 Running Fawn Ct
- 1831 Giant Pine Ave
- 1911 Giant Pine Ave
- 1837 Running Fawn Ct
- 5724 Deer Brush Ct
- 1833 Running Fawn Ct
- 1827 Giant Pine Ave
- 1915 Giant Pine Ave
- 1822 Running Fawn Ct
- 1829 Running Fawn Ct