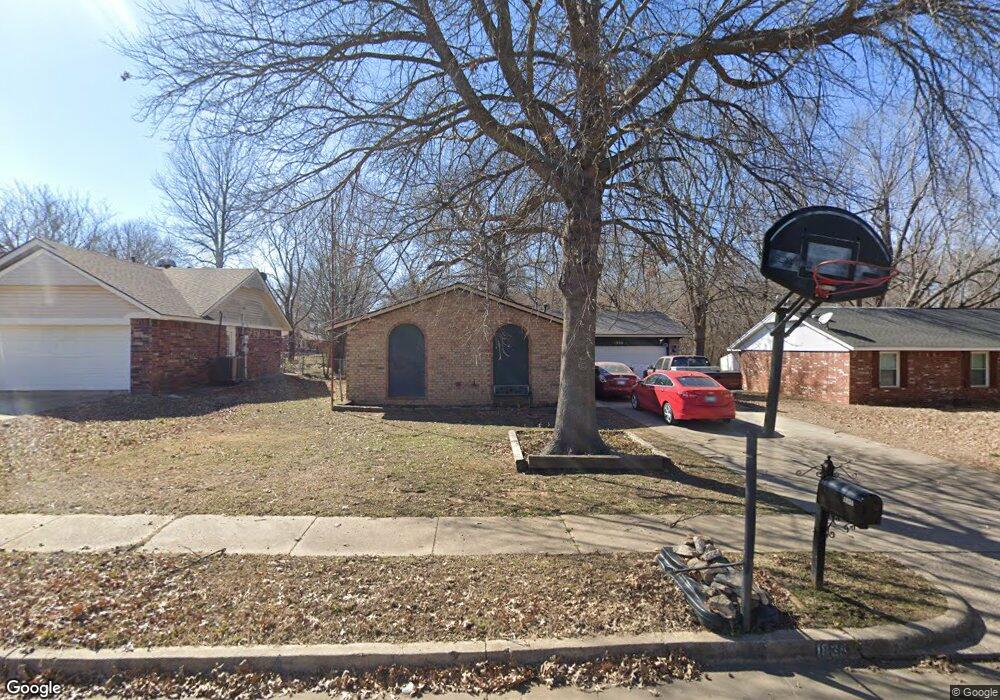
1838 S Muskogee St Sapulpa, OK 74066
Estimated Value: $157,822 - $171,000
3
Beds
2
Baths
1,164
Sq Ft
$139/Sq Ft
Est. Value
About This Home
This home is located at 1838 S Muskogee St, Sapulpa, OK 74066 and is currently estimated at $161,956, approximately $139 per square foot. 1838 S Muskogee St is a home located in Creek County with nearby schools including Sapulpa Middle School, Sapulpa Junior High School, and Sapulpa High School.
Ownership History
Date
Name
Owned For
Owner Type
Purchase Details
Closed on
Oct 31, 2008
Sold by
Federal National Mortgage Association
Bought by
Henson Troy L
Current Estimated Value
Home Financials for this Owner
Home Financials are based on the most recent Mortgage that was taken out on this home.
Original Mortgage
$82,680
Outstanding Balance
$54,048
Interest Rate
6.08%
Mortgage Type
FHA
Estimated Equity
$107,908
Purchase Details
Closed on
Jul 25, 2008
Sold by
Pierce Luther
Bought by
Flagstar Bank Fsb
Purchase Details
Closed on
Nov 9, 2006
Sold by
Barr Robert Bardley and Barr Kari Lee
Bought by
Pierce Luther and Pierce Charlene
Home Financials for this Owner
Home Financials are based on the most recent Mortgage that was taken out on this home.
Original Mortgage
$70,500
Interest Rate
6.26%
Mortgage Type
New Conventional
Create a Home Valuation Report for This Property
The Home Valuation Report is an in-depth analysis detailing your home's value as well as a comparison with similar homes in the area
Home Values in the Area
Average Home Value in this Area
Purchase History
| Date | Buyer | Sale Price | Title Company |
|---|---|---|---|
| Henson Troy L | $78,500 | None Available | |
| Flagstar Bank Fsb | -- | None Available | |
| Pierce Luther | $94,500 | None Available | |
| Barr Robert Bradley | -- | First Title & Abstract Servi |
Source: Public Records
Mortgage History
| Date | Status | Borrower | Loan Amount |
|---|---|---|---|
| Open | Henson Troy L | $82,680 | |
| Previous Owner | Pierce Luther | $70,500 |
Source: Public Records
Tax History Compared to Growth
Tax History
| Year | Tax Paid | Tax Assessment Tax Assessment Total Assessment is a certain percentage of the fair market value that is determined by local assessors to be the total taxable value of land and additions on the property. | Land | Improvement |
|---|---|---|---|---|
| 2025 | $1,777 | $15,346 | $2,400 | $12,946 |
| 2024 | $1,777 | $14,615 | $2,400 | $12,215 |
| 2023 | $1,777 | $13,919 | $2,400 | $11,519 |
| 2022 | $1,523 | $13,256 | $2,400 | $10,856 |
| 2021 | $1,771 | $14,925 | $2,400 | $12,525 |
| 2020 | $1,677 | $14,214 | $2,400 | $11,814 |
| 2019 | $1,605 | $13,537 | $2,400 | $11,137 |
| 2018 | $1,560 | $12,893 | $2,400 | $10,493 |
| 2017 | $1,552 | $12,893 | $2,400 | $10,493 |
| 2016 | $1,436 | $12,551 | $2,237 | $10,314 |
| 2015 | -- | $11,954 | $1,952 | $10,002 |
| 2014 | -- | $11,385 | $1,680 | $9,705 |
Source: Public Records
Map
Nearby Homes
- 1836 S Oklahoma St
- 1915 S Muskogee St
- 605 W Mockingbird Ln
- 1965 S Scott St
- 1220 S Cedar St
- 1424 S Main St
- 119 E Ross Ave
- 925 S Oklahoma St
- 920 S Oklahoma St
- 120 E Burnham Ave
- 909 S Oklahoma St
- 142 W Fairlane Ct
- 910 S Diane St
- 273 W Fairlane Dr
- 41 W Fairlane Ct
- 119 E Davis Ave
- 416 W Fairlane Dr Unit A-B
- 121 E Davis Ave
- 211 E Wells Blvd
- 19 E Fairlane Ct
- 1834 S Muskogee St
- 1842 S Muskogee St
- 1830 S Muskogee St
- 1846 S Muskogee St
- 707 W Mary Lynn Dr
- 1833 S Muskogee St
- 711 W Mary Lynn Dr
- 1837 S Muskogee St
- 1829 S Muskogee St
- 1841 S Muskogee St
- 1825 S Muskogee St
- 715 W Mary Lynn Dr
- 702 W Mary Lynn Dr
- 1845 S Muskogee St
- 1815 S Muskogee St
- 1822 S Muskogee St
- 710 W Mary Lynn Dr
- 1849 S Muskogee St
- 719 W Mary Lynn Dr
- 1828 S Oklahoma St