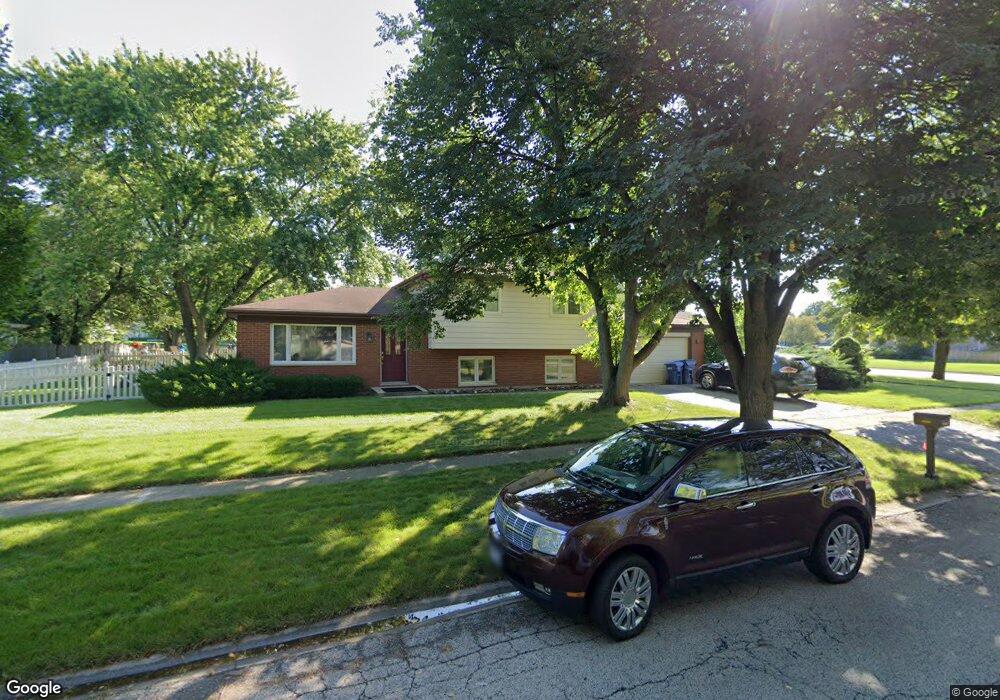
1838 Via Veneto Saint Charles, IL 60174
Southeast Saint Charles NeighborhoodEstimated Value: $374,000 - $411,000
3
Beds
2
Baths
1,226
Sq Ft
$320/Sq Ft
Est. Value
About This Home
This home is located at 1838 Via Veneto, Saint Charles, IL 60174 and is currently estimated at $392,378, approximately $320 per square foot. 1838 Via Veneto is a home located in Kane County with nearby schools including Munhall Elementary School, Wredling Middle School, and St Charles East High School.
Ownership History
Date
Name
Owned For
Owner Type
Purchase Details
Closed on
Sep 23, 2016
Sold by
Turnbull Joseph M and Turnbull Janelle R
Bought by
Turnbull Joseph M and Turnbull Janelle R
Current Estimated Value
Home Financials for this Owner
Home Financials are based on the most recent Mortgage that was taken out on this home.
Original Mortgage
$196,800
Outstanding Balance
$161,768
Interest Rate
4.37%
Mortgage Type
New Conventional
Estimated Equity
$230,610
Purchase Details
Closed on
Mar 28, 2005
Sold by
Anderson Debra K
Bought by
Turnbull Joseph M and Turnbull Janelle R
Purchase Details
Closed on
Jul 24, 1997
Sold by
Anderson Ronald L
Bought by
Anderson Debra K
Home Financials for this Owner
Home Financials are based on the most recent Mortgage that was taken out on this home.
Original Mortgage
$93,000
Interest Rate
6.25%
Create a Home Valuation Report for This Property
The Home Valuation Report is an in-depth analysis detailing your home's value as well as a comparison with similar homes in the area
Home Values in the Area
Average Home Value in this Area
Purchase History
| Date | Buyer | Sale Price | Title Company |
|---|---|---|---|
| Turnbull Joseph M | -- | Snp Title Co | |
| Turnbull Joseph M | $241,500 | Baird & Warner Title Service | |
| Anderson Debra K | -- | First American Title Ins Co |
Source: Public Records
Mortgage History
| Date | Status | Borrower | Loan Amount |
|---|---|---|---|
| Open | Turnbull Joseph M | $196,800 | |
| Previous Owner | Anderson Debra K | $93,000 |
Source: Public Records
Tax History Compared to Growth
Tax History
| Year | Tax Paid | Tax Assessment Tax Assessment Total Assessment is a certain percentage of the fair market value that is determined by local assessors to be the total taxable value of land and additions on the property. | Land | Improvement |
|---|---|---|---|---|
| 2024 | $8,069 | $116,699 | $37,240 | $79,459 |
| 2023 | $7,719 | $104,447 | $33,330 | $71,117 |
| 2022 | $7,009 | $92,806 | $33,203 | $59,603 |
| 2021 | $6,725 | $88,462 | $31,649 | $56,813 |
| 2020 | $6,651 | $86,813 | $31,059 | $55,754 |
| 2019 | $6,528 | $85,094 | $30,444 | $54,650 |
| 2018 | $6,299 | $81,942 | $29,286 | $52,656 |
| 2017 | $6,022 | $77,868 | $28,284 | $49,584 |
| 2016 | $6,316 | $75,134 | $27,291 | $47,843 |
| 2015 | -- | $72,410 | $26,997 | $45,413 |
| 2014 | -- | $70,896 | $26,997 | $43,899 |
| 2013 | -- | $73,035 | $27,267 | $45,768 |
Source: Public Records
Map
Nearby Homes
- 1718 Jeanette Ave
- 1441 Walnut Hill Ave
- 1213 Koster Ct Unit 215
- 1919 Moore Ave
- 702 E Side Dr
- 1527 Williams Ave
- 1526 Kirkwood Dr
- 1598 Kirkwood Dr
- 1518 Williams Ave Unit 1
- 101 Aberdeen Ct
- 111 Aberdeen Ct
- 1328 Hill Rd Unit 5
- 1533 Banbury Ave
- 10 Briar Ln
- 839 N Bennett St
- 33W208 Bonnie St
- 1359 Madison Ct
- 822 Liberty Ave
- 202 N Bennett St
- 1572 Dempsey Dr
- 1706 Division St
- 1830 Via Veneto
- 1712 Division St Unit 4
- 1822 Via Veneto Unit 4
- 1845 Via Veneto
- 1837 Via Veneto
- 1100 Appleton Ln
- 1829 Via Veneto
- 1718 Division St
- 1070 Division St
- 1821 Vía Veneto
- 1814 Via Veneto Unit 4
- 1821 Via Veneto
- 1105 Appleton Ln
- 1110 Appleton Ln
- 1813 Via Veneto
- 1724 Division St Unit 4
- 1707 Patricia Ln
- 1506 Patricia Ln
- 1512 Patricia Ln