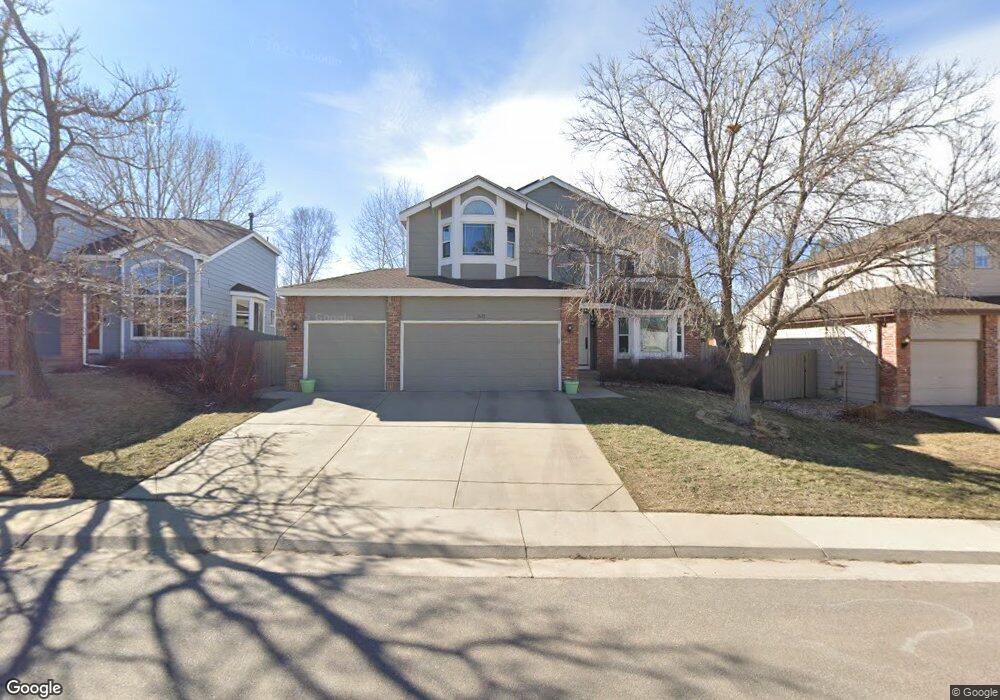
1839 Cedaridge Cir Superior, CO 80027
Estimated Value: $863,864 - $1,064,000
5
Beds
4
Baths
2,203
Sq Ft
$437/Sq Ft
Est. Value
About This Home
This home is located at 1839 Cedaridge Cir, Superior, CO 80027 and is currently estimated at $961,716, approximately $436 per square foot. 1839 Cedaridge Cir is a home located in Boulder County with nearby schools including Eldorado K-8 School, Superior Elementary School, and Monarch High School.
Ownership History
Date
Name
Owned For
Owner Type
Purchase Details
Closed on
Nov 8, 2000
Sold by
Pollard Edward R
Bought by
Dsouza Dylan F and Dsouza Katherine H
Current Estimated Value
Home Financials for this Owner
Home Financials are based on the most recent Mortgage that was taken out on this home.
Original Mortgage
$270,000
Outstanding Balance
$99,348
Interest Rate
7.86%
Estimated Equity
$862,368
Purchase Details
Closed on
Jan 26, 1998
Sold by
Daly Kevin A and Daly Kathleen F
Bought by
Pollard Edward R
Home Financials for this Owner
Home Financials are based on the most recent Mortgage that was taken out on this home.
Original Mortgage
$211,400
Interest Rate
6.62%
Purchase Details
Closed on
Oct 29, 1993
Sold by
Richmond Homes Inc Ii
Bought by
Daly Kevin A
Home Financials for this Owner
Home Financials are based on the most recent Mortgage that was taken out on this home.
Original Mortgage
$182,650
Interest Rate
6.88%
Purchase Details
Closed on
Mar 24, 1992
Bought by
Dsouza Dylan F and Dsouza Katherine H
Create a Home Valuation Report for This Property
The Home Valuation Report is an in-depth analysis detailing your home's value as well as a comparison with similar homes in the area
Home Values in the Area
Average Home Value in this Area
Purchase History
| Date | Buyer | Sale Price | Title Company |
|---|---|---|---|
| Dsouza Dylan F | $337,500 | -- | |
| Pollard Edward R | $234,900 | Land Title | |
| Daly Kevin A | $192,265 | Land Title | |
| Dsouza Dylan F | -- | -- |
Source: Public Records
Mortgage History
| Date | Status | Borrower | Loan Amount |
|---|---|---|---|
| Open | Dsouza Dylan F | $270,000 | |
| Previous Owner | Pollard Edward R | $211,400 | |
| Previous Owner | Daly Kevin A | $182,650 | |
| Closed | Dsouza Dylan F | $33,750 |
Source: Public Records
Tax History Compared to Growth
Tax History
| Year | Tax Paid | Tax Assessment Tax Assessment Total Assessment is a certain percentage of the fair market value that is determined by local assessors to be the total taxable value of land and additions on the property. | Land | Improvement |
|---|---|---|---|---|
| 2025 | $5,867 | $56,107 | $22,444 | $33,663 |
| 2024 | $5,867 | $56,107 | $22,444 | $33,663 |
| 2023 | $5,786 | $56,622 | $19,805 | $40,502 |
| 2022 | $4,512 | $43,132 | $15,436 | $27,696 |
| 2021 | $4,870 | $48,227 | $17,260 | $30,967 |
| 2020 | $4,527 | $43,086 | $17,661 | $25,425 |
| 2019 | $4,464 | $43,086 | $17,661 | $25,425 |
| 2018 | $4,178 | $39,946 | $12,240 | $27,706 |
| 2017 | $4,270 | $44,162 | $13,532 | $30,630 |
| 2016 | $4,171 | $37,690 | $12,656 | $25,034 |
| 2015 | $3,964 | $32,437 | $12,975 | $19,462 |
| 2014 | $3,444 | $32,437 | $12,975 | $19,462 |
Source: Public Records
Map
Nearby Homes
- 1899 Breen Ln
- 1825 Keota Ln
- 1812 Eldorado Dr
- 2112 Grayden Ct
- 1637 Reliance Cir
- 2204 Lasalle St
- 1842 Reliance Cir
- 1302 Eldorado Dr
- 1009 Monarch Way
- 888 Northern Way
- 1122 Eldorado Dr
- 977 Eldorado Dr
- 882 Eldorado Dr
- 1820 Vernon Ln
- 1220 S Boyero Ct
- 1815 Spaulding Cir Unit 1815
- 2169 Eagle Ave Unit 2169
- 2225 Clayton Cir
- 1485 Stoneham St
- 520 Campo Way
- 1849 Cedaridge Cir
- 1819 Cedaridge Cir
- 1859 Cedaridge Cir
- 2017 Eldorado Dr
- 1854 Cedaridge Cir
- 1834 Breen Ln
- 2042 Eldorado Dr
- 2032 Eldorado Dr
- 1869 Cedaridge Cir
- 2007 Eldorado Dr
- 1814 Breen Ln
- 1854 Breen Ln
- 2022 Eldorado Dr
- 1874 Breen Ln
- 2012 Eldorado Dr
- 1874 Cedaridge Cir
- 1997 Eldorado Dr
- 1285 Eldorado Dr
- 2002 Eldorado Dr
- 1894 Breen Ln