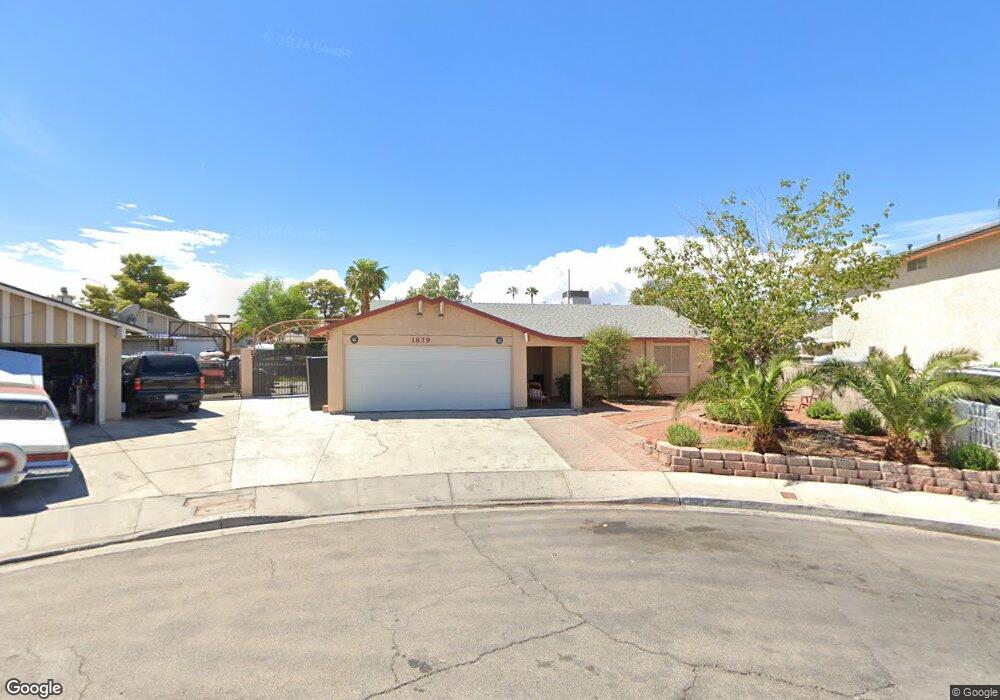
1839 Vanderbilt Ct Las Vegas, NV 89104
Estimated Value: $143,000 - $327,000
3
Beds
2
Baths
1,247
Sq Ft
$160/Sq Ft
Est. Value
About This Home
This home is located at 1839 Vanderbilt Ct, Las Vegas, NV 89104 and is currently estimated at $199,139, approximately $159 per square foot. 1839 Vanderbilt Ct is a home located in Clark County with nearby schools including Walter V. Long Elementary School, Jerome Mack Middle School, and Chaparral High School.
Ownership History
Date
Name
Owned For
Owner Type
Purchase Details
Closed on
May 15, 2025
Sold by
Rincon Rito and Rincon Victor
Bought by
Rincon Meza Revocable Living Trust and Meza
Current Estimated Value
Purchase Details
Closed on
Mar 27, 2025
Sold by
Rincon Victor and Derincon Teresa De
Bought by
Rincon Rito and Ricon Victor
Purchase Details
Closed on
Nov 5, 2018
Sold by
Rincon Victor
Bought by
Rincon Victor and Rincon Teresa De Jesus Mendoza De
Purchase Details
Closed on
Nov 19, 1998
Sold by
Rincon Teresa
Bought by
Rincon Victor
Home Financials for this Owner
Home Financials are based on the most recent Mortgage that was taken out on this home.
Original Mortgage
$100,460
Interest Rate
6.84%
Mortgage Type
FHA
Purchase Details
Closed on
Jan 3, 1997
Sold by
Ibrahim Ghulam and Ibrahim Fazila
Bought by
Rincon Victor
Home Financials for this Owner
Home Financials are based on the most recent Mortgage that was taken out on this home.
Original Mortgage
$95,074
Interest Rate
7.53%
Mortgage Type
FHA
Create a Home Valuation Report for This Property
The Home Valuation Report is an in-depth analysis detailing your home's value as well as a comparison with similar homes in the area
Home Values in the Area
Average Home Value in this Area
Purchase History
| Date | Buyer | Sale Price | Title Company |
|---|---|---|---|
| Rincon Meza Revocable Living Trust | -- | None Listed On Document | |
| Rincon Rito | $143,366 | Clear Title | |
| Rincon Victor | -- | None Available | |
| Rincon Victor | -- | Fidelity National Title | |
| Rincon Victor | $96,000 | First American Title Co |
Source: Public Records
Mortgage History
| Date | Status | Borrower | Loan Amount |
|---|---|---|---|
| Previous Owner | Rincon Victor | $100,460 | |
| Previous Owner | Rincon Victor | $95,074 |
Source: Public Records
Tax History Compared to Growth
Tax History
| Year | Tax Paid | Tax Assessment Tax Assessment Total Assessment is a certain percentage of the fair market value that is determined by local assessors to be the total taxable value of land and additions on the property. | Land | Improvement |
|---|---|---|---|---|
| 2025 | $970 | $50,178 | $27,300 | $22,878 |
| 2024 | $899 | $50,178 | $27,300 | $22,878 |
| 2023 | $599 | $52,497 | $29,750 | $22,747 |
| 2022 | $833 | $45,761 | $24,500 | $21,261 |
| 2021 | $771 | $41,641 | $21,000 | $20,641 |
| 2020 | $713 | $41,514 | $20,650 | $20,864 |
| 2019 | $669 | $40,234 | $19,250 | $20,984 |
| 2018 | $638 | $36,273 | $15,750 | $20,523 |
| 2017 | $1,029 | $35,093 | $14,000 | $21,093 |
| 2016 | $599 | $32,074 | $10,150 | $21,924 |
| 2015 | $596 | $27,702 | $7,700 | $20,002 |
| 2014 | $578 | $21,545 | $5,600 | $15,945 |
Source: Public Records
Map
Nearby Homes
- 1944 Randa Ln
- 4055 E New York Ave
- 3887 Delling Ct
- 1601 S Sandhill Rd Unit 78
- 1601 S Sandhill Rd Unit 191
- 4057 Olive St
- 1892 Miner Way
- 2356 Grannis Ln
- 4067 E Colorado Ave
- 3724 Lanai Ave
- 4170 E Baltimore Ave
- 2278 Miner Way
- 4214 E Baltimore Ave
- 2038 Palm St Unit 407
- 2038 Palm St Unit 60
- 2038 Palm St Unit 427
- 2038 Palm St Unit 321
- 2038 Palm St Unit 298
- 2038 Palm St Unit 47
- 2038 Palm St Unit 81
- 1841 Vanderbilt Ct
- 1840 Dartmouth Ct
- 1823 Vanderbilt Ct
- 1824 Dartmouth Ct
- 1862 Shannon Christine Dr
- 1842 Dartmouth Ct
- 1842 Vanderbilt Ct
- 1874 Shannon Christine Dr
- 1840 Vanderbilt Ct
- 1824 Vanderbilt Ct
- 3890 Sir Bret Ct
- 1886 Shannon Christine Dr
- 3884 Sir Bret Ct
- 1841 Dartmouth Ct
- 3904 E Wyoming Ave
- 3896 E Wyoming Ave
- 3878 Sir Bret Ct
- 3914 E Wyoming Ave
- 3886 E Wyoming Ave