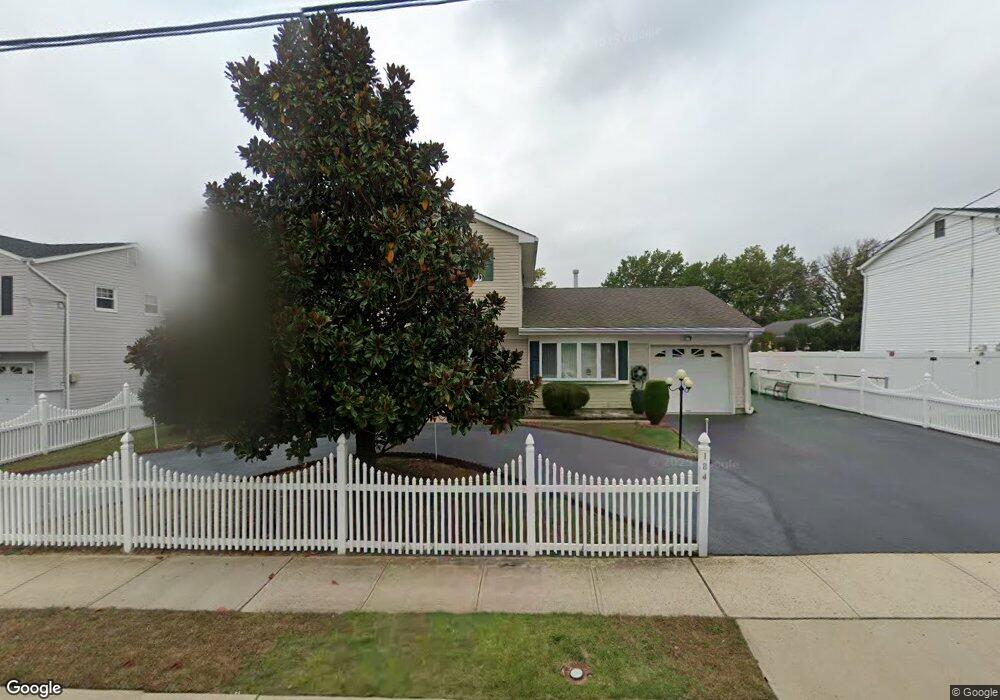
184 Bethany Rd Hazlet, NJ 07730
Estimated Value: $620,000 - $775,000
4
Beds
3
Baths
2,134
Sq Ft
$314/Sq Ft
Est. Value
About This Home
This home is located at 184 Bethany Rd, Hazlet, NJ 07730 and is currently estimated at $669,038, approximately $313 per square foot. 184 Bethany Rd is a home located in Monmouth County with nearby schools including Raritan High School, St Benedict School, and St. Joseph Elementary School.
Ownership History
Date
Name
Owned For
Owner Type
Purchase Details
Closed on
May 30, 2007
Sold by
Teti Frank and Teti Josephine
Bought by
Teti Francesco and Teti Josephine
Current Estimated Value
Purchase Details
Closed on
Feb 7, 1994
Sold by
Lakeview Sav & Loan
Bought by
Teti Frank and Teti Josephine
Home Financials for this Owner
Home Financials are based on the most recent Mortgage that was taken out on this home.
Original Mortgage
$112,000
Interest Rate
6.96%
Create a Home Valuation Report for This Property
The Home Valuation Report is an in-depth analysis detailing your home's value as well as a comparison with similar homes in the area
Home Values in the Area
Average Home Value in this Area
Purchase History
| Date | Buyer | Sale Price | Title Company |
|---|---|---|---|
| Teti Francesco | -- | None Available | |
| Teti Frank | $140,000 | -- |
Source: Public Records
Mortgage History
| Date | Status | Borrower | Loan Amount |
|---|---|---|---|
| Closed | Teti Frank | $112,000 |
Source: Public Records
Tax History Compared to Growth
Tax History
| Year | Tax Paid | Tax Assessment Tax Assessment Total Assessment is a certain percentage of the fair market value that is determined by local assessors to be the total taxable value of land and additions on the property. | Land | Improvement |
|---|---|---|---|---|
| 2025 | $9,733 | $515,500 | $346,000 | $169,500 |
| 2024 | $9,473 | $462,800 | $294,000 | $168,800 |
| 2023 | $9,473 | $443,300 | $276,000 | $167,300 |
| 2022 | $8,361 | $390,700 | $229,000 | $161,700 |
| 2021 | $8,361 | $353,900 | $210,000 | $143,900 |
| 2020 | $8,923 | $345,600 | $205,000 | $140,600 |
| 2019 | $8,651 | $329,800 | $190,000 | $139,800 |
| 2018 | $8,419 | $318,300 | $185,000 | $133,300 |
| 2017 | $7,940 | $300,200 | $171,000 | $129,200 |
| 2016 | $7,826 | $297,000 | $171,000 | $126,000 |
| 2015 | $7,621 | $290,000 | $166,000 | $124,000 |
| 2014 | $7,577 | $270,400 | $130,000 | $140,400 |
Source: Public Records
Map
Nearby Homes