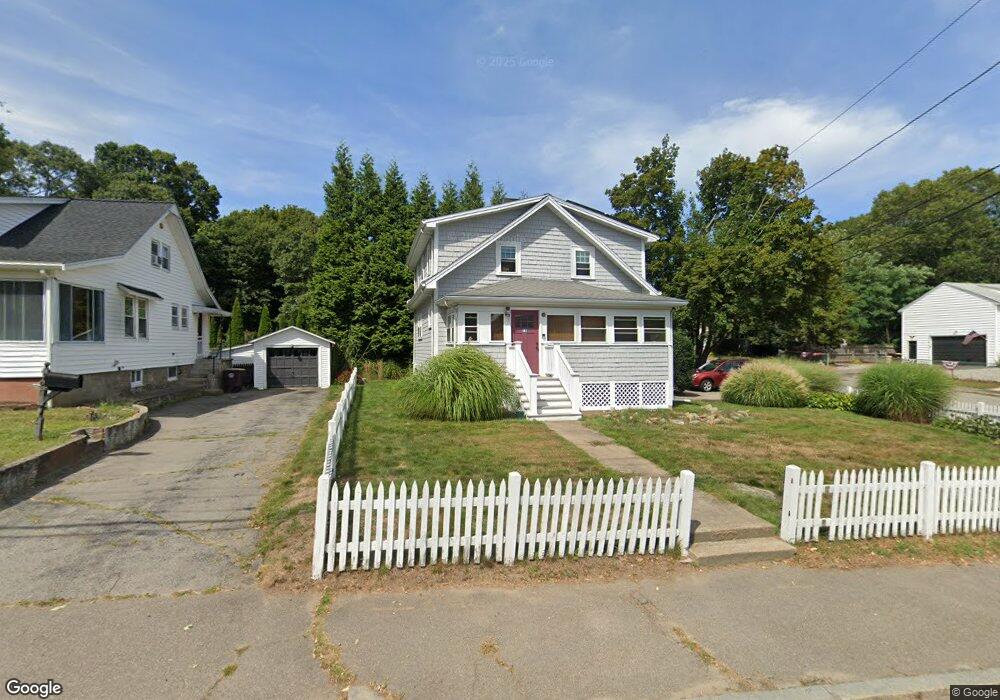
184 Broad St Weymouth, MA 02188
Weymouth Landing NeighborhoodEstimated Value: $573,000 - $596,000
3
Beds
1
Bath
1,590
Sq Ft
$365/Sq Ft
Est. Value
About This Home
This home is located at 184 Broad St, Weymouth, MA 02188 and is currently estimated at $580,574, approximately $365 per square foot. 184 Broad St is a home located in Norfolk County with nearby schools including Abigail Adams Middle School, Frederick C Murphy, and Weymouth Middle School Chapman.
Ownership History
Date
Name
Owned For
Owner Type
Purchase Details
Closed on
Apr 29, 1997
Sold by
Evans William J and Evans Diane M
Bought by
Bachofner Margaret A
Current Estimated Value
Home Financials for this Owner
Home Financials are based on the most recent Mortgage that was taken out on this home.
Original Mortgage
$128,250
Outstanding Balance
$17,217
Interest Rate
7.77%
Mortgage Type
Purchase Money Mortgage
Estimated Equity
$563,357
Purchase Details
Closed on
Jul 14, 1989
Sold by
Barton Thomas N
Bought by
Evans William J
Create a Home Valuation Report for This Property
The Home Valuation Report is an in-depth analysis detailing your home's value as well as a comparison with similar homes in the area
Home Values in the Area
Average Home Value in this Area
Purchase History
| Date | Buyer | Sale Price | Title Company |
|---|---|---|---|
| Bachofner Margaret A | $135,000 | -- | |
| Evans William J | $146,000 | -- |
Source: Public Records
Mortgage History
| Date | Status | Borrower | Loan Amount |
|---|---|---|---|
| Open | Evans William J | $32,000 | |
| Open | Evans William J | $128,250 | |
| Previous Owner | Evans William J | $10,000 |
Source: Public Records
Tax History Compared to Growth
Tax History
| Year | Tax Paid | Tax Assessment Tax Assessment Total Assessment is a certain percentage of the fair market value that is determined by local assessors to be the total taxable value of land and additions on the property. | Land | Improvement |
|---|---|---|---|---|
| 2025 | $4,785 | $473,800 | $193,500 | $280,300 |
| 2024 | $4,635 | $451,300 | $184,300 | $267,000 |
| 2023 | $4,472 | $427,900 | $170,600 | $257,300 |
| 2022 | $4,355 | $380,000 | $158,000 | $222,000 |
| 2021 | $3,985 | $339,400 | $158,000 | $181,400 |
| 2020 | $3,782 | $317,300 | $158,000 | $159,300 |
| 2019 | $3,689 | $304,400 | $151,900 | $152,500 |
| 2018 | $3,575 | $286,000 | $144,700 | $141,300 |
| 2017 | $3,306 | $258,100 | $137,800 | $120,300 |
| 2016 | $3,177 | $248,200 | $132,500 | $115,700 |
| 2015 | $3,068 | $237,800 | $132,500 | $105,300 |
| 2014 | $2,938 | $220,900 | $123,300 | $97,600 |
Source: Public Records
Map
Nearby Homes
- 9 Vine St Unit 1
- 19 Vine St Unit 4
- 28 Webb St
- 114 Broad St Unit D
- 114 Broad St Unit C
- 286 Broad St
- 25 Richmond St
- 23-25 Lindbergh Ave
- 16 Lindbergh Ave
- 19 Common St
- 11 Richmond St
- 122 Washington St Unit 22
- 17 Worster Terrace
- 93 Wilson Ave
- 33 Congress St
- 271 Roosevelt Rd
- 294 Commercial St
- 15 Summer St
- 36 Brookside Rd
- 11 Thayer Ave