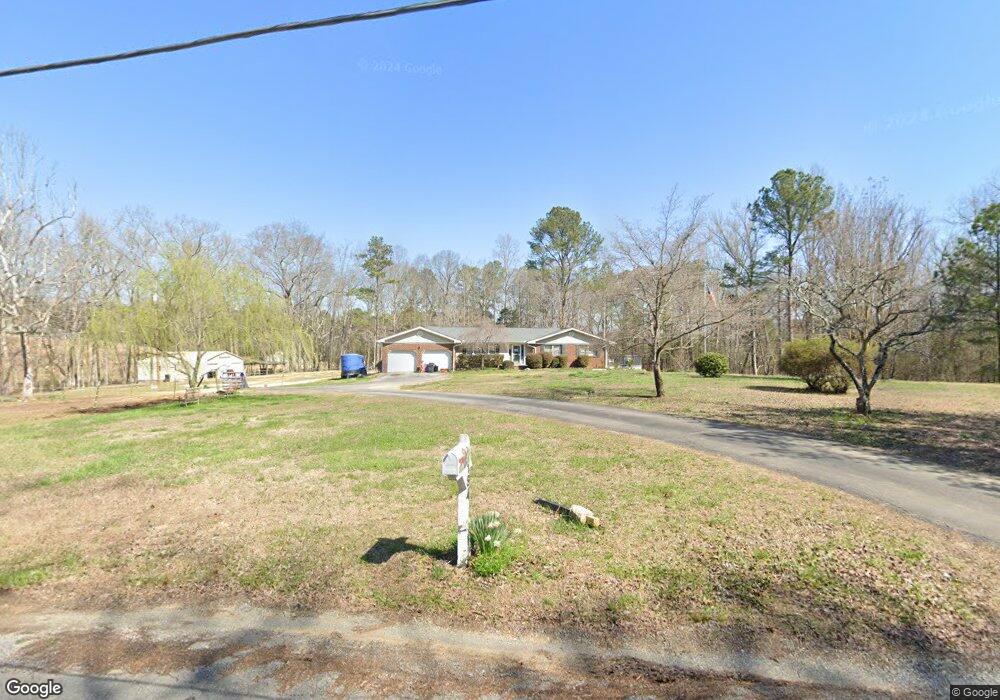
184 Chapman Rd La Fayette, GA 30728
Estimated Value: $335,000 - $516,000
--
Bed
2
Baths
1,844
Sq Ft
$215/Sq Ft
Est. Value
About This Home
This home is located at 184 Chapman Rd, La Fayette, GA 30728 and is currently estimated at $396,601, approximately $215 per square foot. 184 Chapman Rd is a home located in Walker County with nearby schools including Rock Spring Elementary School and Lafayette High School.
Ownership History
Date
Name
Owned For
Owner Type
Purchase Details
Closed on
Oct 2, 2017
Sold by
Ladd Charles L
Bought by
Dobbs William and Dobbs Mikki
Current Estimated Value
Home Financials for this Owner
Home Financials are based on the most recent Mortgage that was taken out on this home.
Original Mortgage
$230,000
Outstanding Balance
$192,115
Interest Rate
3.82%
Mortgage Type
VA
Estimated Equity
$204,486
Purchase Details
Closed on
Dec 1, 2004
Sold by
Finkbone William D
Bought by
Ladd Charles L and Ladd Patricia A
Purchase Details
Closed on
Oct 25, 2002
Sold by
Finkbone Carolyn
Bought by
Finkbone William D
Purchase Details
Closed on
Aug 6, 2002
Sold by
Simpson Tony and Simpson Beth
Bought by
Webb J Rodney
Purchase Details
Closed on
May 1, 1995
Sold by
Miller Carl Wayne and Miller Sharon
Bought by
Simpson Tony and Simpson Beth
Purchase Details
Closed on
Nov 13, 1987
Sold by
Martha Charles E and Martha Jane
Bought by
Miller Carl Wayne and Miller Sharon
Purchase Details
Closed on
Mar 17, 1978
Bought by
Martha Charles E and Martha Jane
Create a Home Valuation Report for This Property
The Home Valuation Report is an in-depth analysis detailing your home's value as well as a comparison with similar homes in the area
Home Values in the Area
Average Home Value in this Area
Purchase History
| Date | Buyer | Sale Price | Title Company |
|---|---|---|---|
| Dobbs William | $230,000 | -- | |
| Ladd Charles L | $170,000 | -- | |
| Finkbone William D | -- | -- | |
| Finkbone Carolyn | $148,800 | -- | |
| Webb J Rodney | -- | -- | |
| Simpson Tony | $78,500 | -- | |
| Miller Carl Wayne | $73,900 | -- | |
| Martha Charles E | -- | -- |
Source: Public Records
Mortgage History
| Date | Status | Borrower | Loan Amount |
|---|---|---|---|
| Open | Dobbs William | $230,000 |
Source: Public Records
Tax History Compared to Growth
Tax History
| Year | Tax Paid | Tax Assessment Tax Assessment Total Assessment is a certain percentage of the fair market value that is determined by local assessors to be the total taxable value of land and additions on the property. | Land | Improvement |
|---|---|---|---|---|
| 2024 | $2,650 | $119,789 | $21,631 | $98,158 |
| 2023 | $2,503 | $110,386 | $17,167 | $93,219 |
| 2022 | $2,387 | $96,809 | $16,123 | $80,686 |
| 2021 | $2,219 | $81,144 | $16,123 | $65,021 |
| 2020 | $1,972 | $68,973 | $16,123 | $52,850 |
| 2019 | $2,007 | $68,973 | $16,123 | $52,850 |
| 2018 | $1,825 | $68,973 | $16,123 | $52,850 |
| 2017 | $1,219 | $64,075 | $15,240 | $48,835 |
| 2016 | $817 | $64,075 | $15,240 | $48,835 |
| 2015 | $653 | $55,577 | $13,164 | $42,413 |
| 2014 | $541 | $55,577 | $13,164 | $42,413 |
| 2013 | -- | $55,577 | $13,164 | $42,413 |
Source: Public Records
Map
Nearby Homes
- 1052 Huffman Rd
- 0 Alabama Hwy Unit TRACT 3 10244950
- 0 Alabama Hwy Unit 1520958
- 0 Alabama Hwy Unit 21222630
- Old Alabama Hwy Ga-151
- 201 Van Dell Dr
- 1314 Mcintire Rd
- 0 Georgia 95
- 200 Cattail Dr
- 7606 Highway 95
- 182 Boxer Ln
- 533 Van Dell Dr
- 72 Brutis Dr
- 106 Meadow Oak Dr
- 58 Oak Run
- 15 Brutis Dr
- 23 Oak Meadow Dr
- 5062 Georgia 95
- 57 McGaha Rd
- 6280 Georgia 151
- 184 Chapman Rd
- 256 Chapman Rd
- 193 Chapman Rd
- 279 Chapman Ct
- 294 Chapman Rd
- 916 Highway 151
- 318 Chapman Rd
- 279 Chapman Rd
- 872 Highway 151
- 110 Chapman Ct
- 1060 Highway 151
- 281 Chapman Rd
- 351 Chapman Rd
- 967 Highway 151
- 194 Chapman Ct
- 865 Highway 151
- 210 Chapman Ct
- 210 Chapman Ct
- 35 Chapman Ct
- 129 Chapman Ct