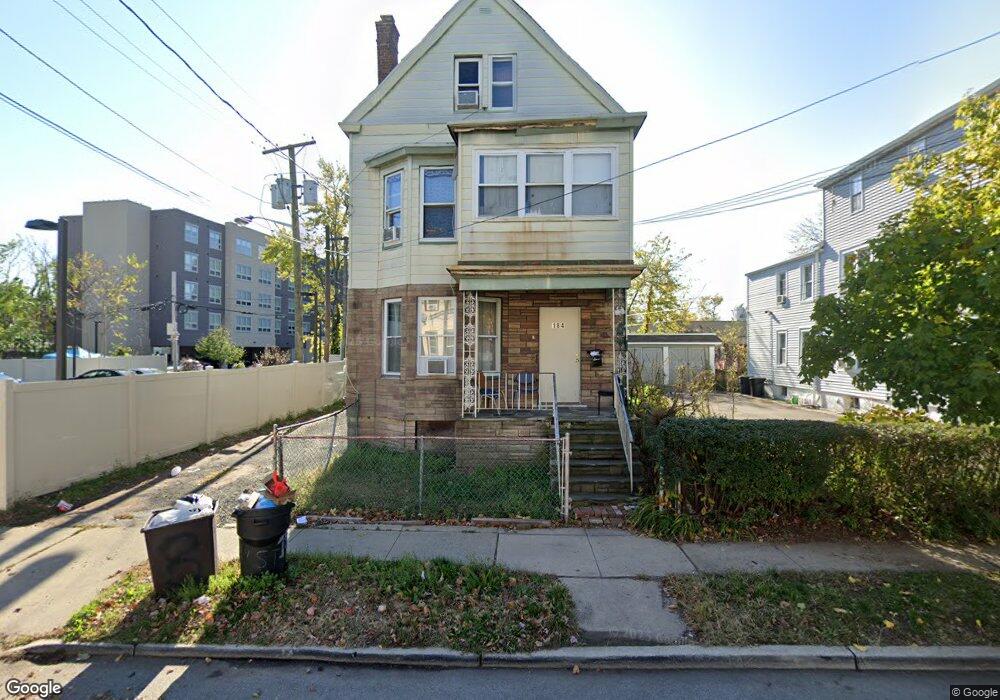
184 Chapman St Orange, NJ 07050
Estimated Value: $478,000 - $578,000
--
Bed
--
Bath
2,250
Sq Ft
$226/Sq Ft
Est. Value
About This Home
This home is located at 184 Chapman St, Orange, NJ 07050 and is currently estimated at $508,040, approximately $225 per square foot. 184 Chapman St is a home located in Essex County.
Ownership History
Date
Name
Owned For
Owner Type
Purchase Details
Closed on
Dec 23, 2004
Current Estimated Value
Purchase Details
Closed on
May 18, 2000
Sold by
Lasalle National Bank
Bought by
Ghebrehiwet Teblez
Purchase Details
Closed on
Apr 16, 1999
Sold by
Tekilit Laine
Bought by
Gheremichael Tseba
Home Financials for this Owner
Home Financials are based on the most recent Mortgage that was taken out on this home.
Original Mortgage
$116,000
Interest Rate
7.02%
Create a Home Valuation Report for This Property
The Home Valuation Report is an in-depth analysis detailing your home's value as well as a comparison with similar homes in the area
Home Values in the Area
Average Home Value in this Area
Purchase History
| Date | Buyer | Sale Price | Title Company |
|---|---|---|---|
| -- | $500 | -- | |
| Ghebrehiwet Teblez | $65,000 | -- | |
| Ghebrehiwet Teblez | $65,000 | -- | |
| Gheremichael Tseba | $145,000 | -- |
Source: Public Records
Mortgage History
| Date | Status | Borrower | Loan Amount |
|---|---|---|---|
| Previous Owner | Gheremichael Tseba | $116,000 |
Source: Public Records
Tax History Compared to Growth
Tax History
| Year | Tax Paid | Tax Assessment Tax Assessment Total Assessment is a certain percentage of the fair market value that is determined by local assessors to be the total taxable value of land and additions on the property. | Land | Improvement |
|---|---|---|---|---|
| 2025 | $10,868 | $291,600 | $99,600 | $192,000 |
| 2024 | $10,868 | $291,600 | $99,600 | $192,000 |
| 2022 | $10,107 | $291,600 | $99,600 | $192,000 |
| 2021 | $8,994 | $155,600 | $33,500 | $122,100 |
| 2020 | $8,724 | $155,600 | $33,500 | $122,100 |
| 2019 | $8,270 | $155,600 | $33,500 | $122,100 |
| 2018 | $8,138 | $155,600 | $33,500 | $122,100 |
| 2017 | $7,578 | $155,600 | $33,500 | $122,100 |
| 2016 | $7,435 | $155,600 | $33,500 | $122,100 |
| 2015 | $7,240 | $155,600 | $33,500 | $122,100 |
| 2014 | $6,923 | $155,600 | $33,500 | $122,100 |
Source: Public Records
Map
Nearby Homes
- 167 Chapman St
- 28 Metzger Dr
- 200 Taylor St
- 177 Central Place
- 232 Ivy Ct
- 237 Ivy Ct
- 129 Central Place
- 129 Central Place Unit 2
- 216 Oakwood Place
- 27 Oakwood Ave
- 309 Olcott St
- 208 Reynolds St
- 326 Ogden St
- 108 Oakwood Ave
- 389 Olcott St
- 356 Henry St
- 21 Oakwood Ave
- 191 Matthew St
- 231 Highland Ave
- 353 Claredon Place