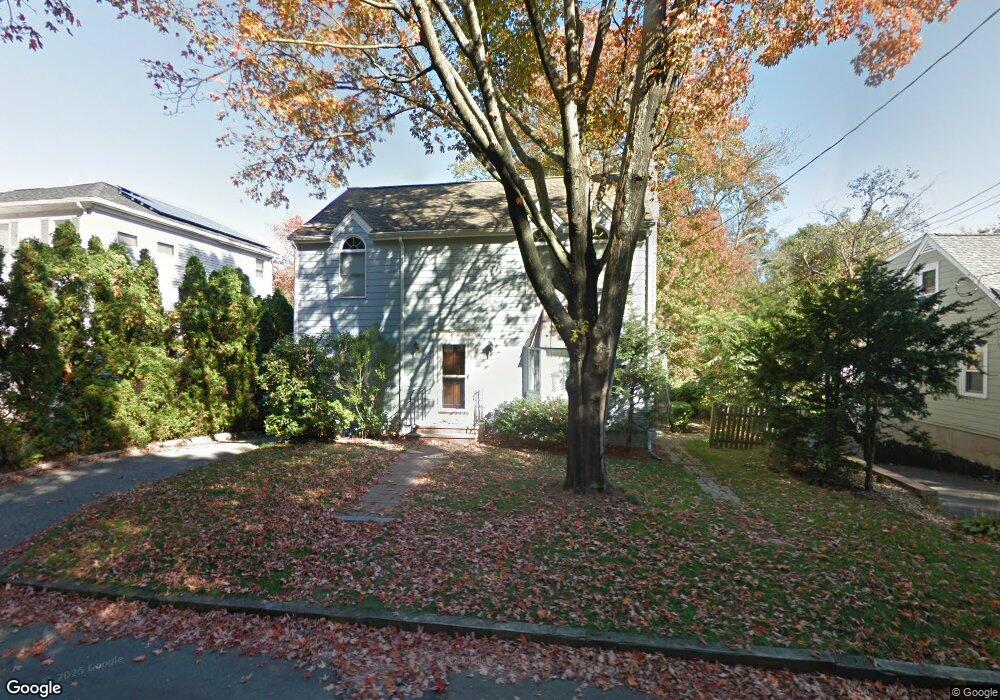
184 Dothan St Winchester, MA 01890
West Side NeighborhoodEstimated Value: $1,139,000 - $1,327,000
3
Beds
3
Baths
2,000
Sq Ft
$603/Sq Ft
Est. Value
About This Home
This home is located at 184 Dothan St, Winchester, MA 01890 and is currently estimated at $1,205,827, approximately $602 per square foot. 184 Dothan St is a home located in Middlesex County with nearby schools including Vinson-Owen Elementary School, McCall Middle School, and Winchester High School.
Ownership History
Date
Name
Owned For
Owner Type
Purchase Details
Closed on
Dec 17, 2004
Sold by
Scully Emily and Scully John
Bought by
Porecha Nikhil and Porecha Saaima
Current Estimated Value
Purchase Details
Closed on
Nov 19, 1997
Sold by
Minkowitz Charlotte S
Bought by
Scully John and Scully Emily
Create a Home Valuation Report for This Property
The Home Valuation Report is an in-depth analysis detailing your home's value as well as a comparison with similar homes in the area
Home Values in the Area
Average Home Value in this Area
Purchase History
| Date | Buyer | Sale Price | Title Company |
|---|---|---|---|
| Porecha Nikhil | $587,000 | -- | |
| Scully John | $170,000 | -- |
Source: Public Records
Mortgage History
| Date | Status | Borrower | Loan Amount |
|---|---|---|---|
| Open | Scully John | $417,000 | |
| Closed | Scully John | $417,000 | |
| Closed | Scully John | $417,000 |
Source: Public Records
Tax History
| Year | Tax Paid | Tax Assessment Tax Assessment Total Assessment is a certain percentage of the fair market value that is determined by local assessors to be the total taxable value of land and additions on the property. | Land | Improvement |
|---|---|---|---|---|
| 2025 | $108 | $975,000 | $589,000 | $386,000 |
| 2024 | $10,719 | $946,100 | $589,000 | $357,100 |
| 2023 | $10,483 | $888,400 | $539,900 | $348,500 |
| 2022 | $9,504 | $759,700 | $409,000 | $350,700 |
| 2021 | $9,642 | $751,500 | $400,800 | $350,700 |
| 2020 | $9,311 | $751,500 | $400,800 | $350,700 |
| 2019 | $8,309 | $686,100 | $335,400 | $350,700 |
| 2018 | $8,068 | $659,700 | $319,000 | $340,700 |
| 2017 | $6,924 | $623,300 | $302,700 | $320,600 |
| 2016 | $7,162 | $613,200 | $302,700 | $310,500 |
| 2015 | $6,950 | $572,500 | $274,000 | $298,500 |
| 2014 | $6,654 | $525,600 | $237,200 | $288,400 |
Source: Public Records
Map
Nearby Homes
Your Personal Tour Guide
Ask me questions while you tour the home.