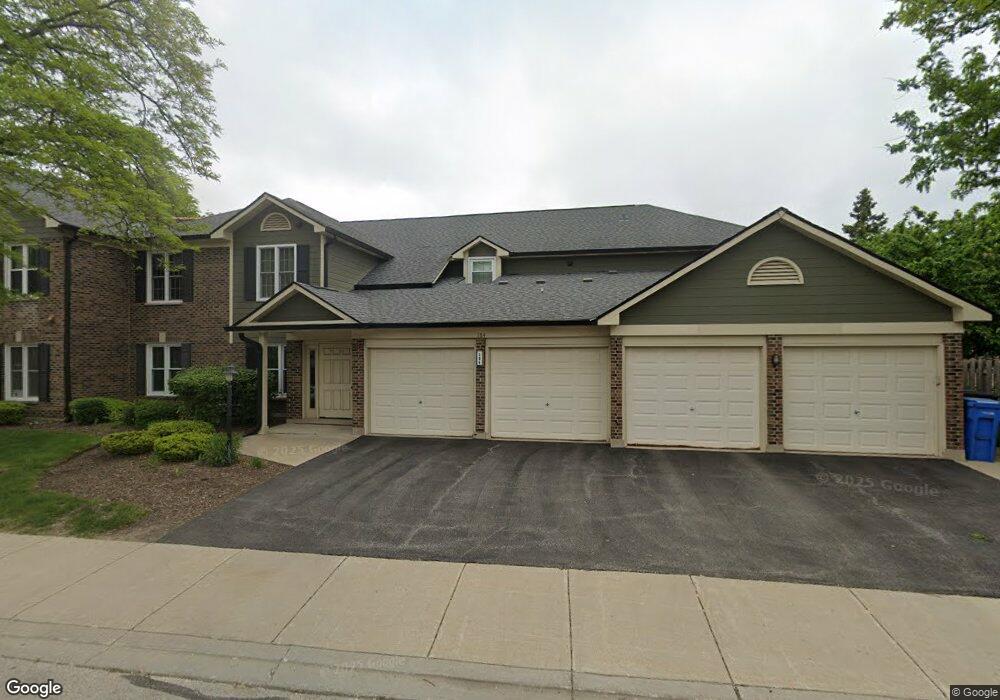
184 Grove Ave Unit 82D Des Plaines, IL 60016
Estimated Value: $230,702 - $269,000
--
Bed
--
Bath
14,218
Sq Ft
$18/Sq Ft
Est. Value
About This Home
This home is located at 184 Grove Ave Unit 82D, Des Plaines, IL 60016 and is currently estimated at $257,426, approximately $18 per square foot. 184 Grove Ave Unit 82D is a home located in Cook County with nearby schools including North Elementary School, Chippewa Middle School, and Maine West High School.
Ownership History
Date
Name
Owned For
Owner Type
Purchase Details
Closed on
Feb 18, 2016
Sold by
Neuman Allen
Bought by
The Allen Melvin Neuman Living Trust
Current Estimated Value
Create a Home Valuation Report for This Property
The Home Valuation Report is an in-depth analysis detailing your home's value as well as a comparison with similar homes in the area
Home Values in the Area
Average Home Value in this Area
Purchase History
| Date | Buyer | Sale Price | Title Company |
|---|---|---|---|
| The Allen Melvin Neuman Living Trust | -- | Premier Title |
Source: Public Records
Tax History Compared to Growth
Tax History
| Year | Tax Paid | Tax Assessment Tax Assessment Total Assessment is a certain percentage of the fair market value that is determined by local assessors to be the total taxable value of land and additions on the property. | Land | Improvement |
|---|---|---|---|---|
| 2024 | $2,747 | $16,388 | $2,956 | $13,432 |
| 2023 | $2,632 | $16,388 | $2,956 | $13,432 |
| 2022 | $2,632 | $16,388 | $2,956 | $13,432 |
| 2021 | $1,454 | $10,726 | $3,589 | $7,137 |
| 2020 | $1,554 | $10,726 | $3,589 | $7,137 |
| 2019 | $1,576 | $12,030 | $3,589 | $8,441 |
| 2018 | $1,042 | $9,667 | $3,166 | $6,501 |
| 2017 | $622 | $9,667 | $3,166 | $6,501 |
| 2016 | $1,217 | $9,667 | $3,166 | $6,501 |
| 2015 | $1,390 | $9,118 | $2,744 | $6,374 |
| 2014 | $1,333 | $9,118 | $2,744 | $6,374 |
| 2013 | $1,330 | $9,118 | $2,744 | $6,374 |
Source: Public Records
Map
Nearby Homes
- 1578 Woodland Ave Unit D
- 185 Eli Ct
- 184 Lilah Ct
- 182 Lilah Ct
- 182 Eli Ct
- 1433 Willow Ave
- 365 Graceland Ave Unit 205A
- 430 Oak St
- 394 Alles St Unit 3B
- 395 Graceland Ave Unit 207
- 476 Alles St Unit 508
- 476 Alles St Unit 210
- 501 Alles St Unit 501A
- 1279 Harding Ave Unit 3B
- 1279 Harding Ave Unit 2B
- 555 S River Rd Unit 301
- 1470 Jefferson St Unit 504
- 1470 Jefferson St Unit 405
- 1389 Perry St Unit 303
- 550 Ida St Unit 2NW
- 184 Grove Ave Unit B
- 184 Grove Ave Unit 81B
- 184 Grove Ave Unit 82C
- 184 Grove Ave Unit 81A
- 184 Grove Ave
- 186 Grove Ave Unit 71B
- 186 Grove Ave Unit 71A
- 186 Grove Ave Unit 72D
- 186 Grove Ave Unit 72C
- 186 Grove Ave Unit A
- 186 Grove Ave Unit C
- 188 Grove Ave Unit 62D
- 188 Grove Ave Unit 62C
- 188 Grove Ave Unit 61B
- 188 Grove Ave Unit 61A
- 188 Grove Ave Unit D
- 188 Grove Ave Unit C
- 192 Grove Ave Unit 41B
- 192 Grove Ave Unit 42C
- 192 Grove Ave Unit 42D