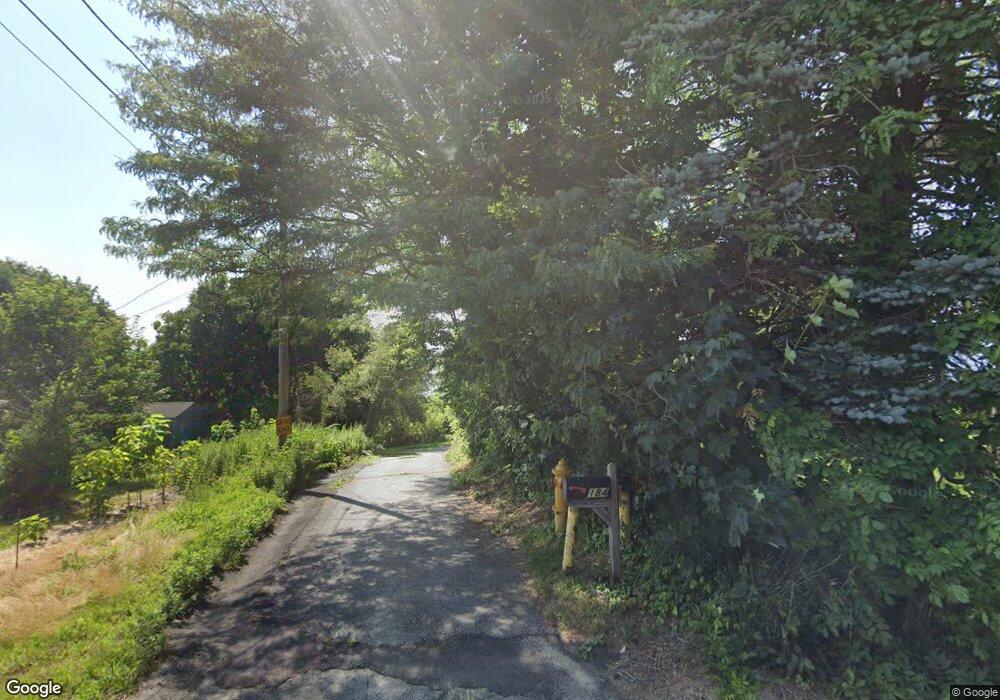
184 Haskins Ave Tiverton, RI 02878
North Tiverton NeighborhoodEstimated Value: $655,591 - $773,000
3
Beds
3
Baths
2,002
Sq Ft
$351/Sq Ft
Est. Value
About This Home
This home is located at 184 Haskins Ave, Tiverton, RI 02878 and is currently estimated at $702,148, approximately $350 per square foot. 184 Haskins Ave is a home located in Newport County with nearby schools including Tiverton High School, Argosy Collegiate Charter School, and Saint Stanislaus School.
Ownership History
Date
Name
Owned For
Owner Type
Purchase Details
Closed on
Apr 27, 2010
Sold by
Addario Richard P
Bought by
Yatsevitch Michael A
Current Estimated Value
Home Financials for this Owner
Home Financials are based on the most recent Mortgage that was taken out on this home.
Original Mortgage
$239,200
Outstanding Balance
$159,933
Interest Rate
5%
Mortgage Type
Purchase Money Mortgage
Estimated Equity
$542,215
Purchase Details
Closed on
Aug 17, 2009
Sold by
Daddario Richard P
Bought by
Vieira Gary F
Create a Home Valuation Report for This Property
The Home Valuation Report is an in-depth analysis detailing your home's value as well as a comparison with similar homes in the area
Home Values in the Area
Average Home Value in this Area
Purchase History
| Date | Buyer | Sale Price | Title Company |
|---|---|---|---|
| Yatsevitch Michael A | $299,000 | -- | |
| Vieira Gary F | $6,000 | -- |
Source: Public Records
Mortgage History
| Date | Status | Borrower | Loan Amount |
|---|---|---|---|
| Open | Vieira Gary F | $239,200 | |
| Previous Owner | Vieira Gary F | $50,000 | |
| Previous Owner | Vieira Gary F | $133,300 | |
| Previous Owner | Vieira Gary F | $15,000 |
Source: Public Records
Tax History Compared to Growth
Tax History
| Year | Tax Paid | Tax Assessment Tax Assessment Total Assessment is a certain percentage of the fair market value that is determined by local assessors to be the total taxable value of land and additions on the property. | Land | Improvement |
|---|---|---|---|---|
| 2025 | $5,975 | $540,700 | $242,200 | $298,500 |
| 2024 | $5,975 | $540,700 | $242,200 | $298,500 |
| 2023 | $5,972 | $400,800 | $157,100 | $243,700 |
| 2022 | $5,864 | $400,800 | $157,100 | $243,700 |
| 2021 | $5,719 | $400,800 | $157,100 | $243,700 |
| 2020 | $5,233 | $323,200 | $118,700 | $204,500 |
| 2019 | $5,103 | $323,200 | $118,700 | $204,500 |
| 2018 | $5,297 | $323,200 | $118,700 | $204,500 |
| 2017 | $5,496 | $288,500 | $118,700 | $169,800 |
| 2016 | $5,522 | $288,500 | $118,700 | $169,800 |
| 2015 | $5,522 | $288,500 | $118,700 | $169,800 |
| 2014 | $5,746 | $297,700 | $118,700 | $179,000 |
Source: Public Records
Map
Nearby Homes