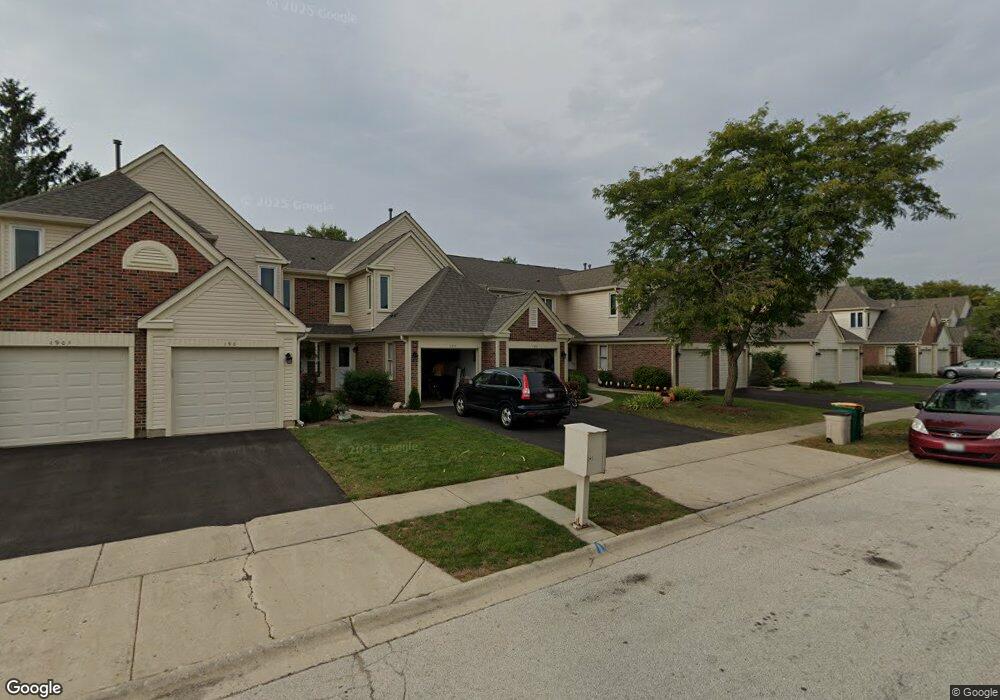
184 Inverness Ct Unit 115 Elk Grove Village, IL 60007
Elk Grove Village West NeighborhoodEstimated Value: $302,000 - $349,905
3
Beds
--
Bath
1,400
Sq Ft
$239/Sq Ft
Est. Value
About This Home
This home is located at 184 Inverness Ct Unit 115, Elk Grove Village, IL 60007 and is currently estimated at $334,726, approximately $239 per square foot. 184 Inverness Ct Unit 115 is a home located in Cook County with nearby schools including Michael Collins Elementary School, Margaret Mead Junior High School, and J B Conant High School.
Ownership History
Date
Name
Owned For
Owner Type
Purchase Details
Closed on
Nov 25, 2024
Sold by
Schwarz Katharina
Bought by
Katharina A Schwarz Trust and Schwarz
Current Estimated Value
Purchase Details
Closed on
Nov 10, 2016
Sold by
Janus Joseph and Janus Zofia E
Bought by
Schwarz Katharina
Purchase Details
Closed on
Nov 15, 1999
Sold by
Janus Joseph
Bought by
Janus Joseph and Janus Zofia E
Purchase Details
Closed on
Sep 14, 1999
Sold by
Holther Gary M
Bought by
Janus Joseph
Home Financials for this Owner
Home Financials are based on the most recent Mortgage that was taken out on this home.
Original Mortgage
$138,600
Interest Rate
7.93%
Create a Home Valuation Report for This Property
The Home Valuation Report is an in-depth analysis detailing your home's value as well as a comparison with similar homes in the area
Home Values in the Area
Average Home Value in this Area
Purchase History
| Date | Buyer | Sale Price | Title Company |
|---|---|---|---|
| Katharina A Schwarz Trust | -- | None Listed On Document | |
| Katharina A Schwarz Trust | -- | None Listed On Document | |
| Katharina A Schwarz Trust | -- | None Listed On Document | |
| Schwarz Katharina | $217,500 | Premier Title | |
| Janus Joseph | -- | -- | |
| Janus Joseph | $154,000 | -- |
Source: Public Records
Mortgage History
| Date | Status | Borrower | Loan Amount |
|---|---|---|---|
| Previous Owner | Janus Joseph | $138,600 |
Source: Public Records
Tax History Compared to Growth
Tax History
| Year | Tax Paid | Tax Assessment Tax Assessment Total Assessment is a certain percentage of the fair market value that is determined by local assessors to be the total taxable value of land and additions on the property. | Land | Improvement |
|---|---|---|---|---|
| 2024 | $6,479 | $25,661 | $5,230 | $20,431 |
| 2023 | $6,263 | $25,661 | $5,230 | $20,431 |
| 2022 | $6,263 | $25,661 | $5,230 | $20,431 |
| 2021 | $5,280 | $20,028 | $6,700 | $13,328 |
| 2020 | $5,218 | $20,028 | $6,700 | $13,328 |
| 2019 | $6,170 | $22,265 | $6,700 | $15,565 |
| 2018 | $5,591 | $18,050 | $5,638 | $12,412 |
| 2017 | $5,516 | $18,050 | $5,638 | $12,412 |
| 2016 | $4,437 | $18,050 | $5,638 | $12,412 |
| 2015 | $3,951 | $15,480 | $4,902 | $10,578 |
| 2014 | $3,912 | $15,480 | $4,902 | $10,578 |
| 2013 | $3,793 | $15,480 | $4,902 | $10,578 |
Source: Public Records
Map
Nearby Homes
- 160 Inverness Ct Unit A
- 722 Merlin Dr Unit 16
- 1221 Plum Tree Ct Unit 5481RD
- 1385 Scarboro Rd Unit 204
- 1254 Plum Tree Ct Unit A1
- 1251 Williamsburg Dr Unit D-1
- 517 E Weathersfield Way
- 310 Oak Meadow Ct Unit D2
- 321 Woodbury Ct Unit D2
- 101 Bar Harbour Rd Unit 6
- 731 Highpoint Ct
- 1567 California St
- 151 Brookston Dr Unit A2
- 375 Pinetree Ln Unit D-1
- 15 Bar Harbour Rd Unit 4F
- 1437 Whitman Ct
- 402 Sandalwood Ln Unit C1
- 236 Deerpath Ct Unit 3333LA
- 924 Surrey Dr Unit 1A
- 601 Eastview Ct Unit Z1
- 184 Inverness Ct Unit 5
- 186 Inverness Ct Unit 114
- 182 Inverness Ct Unit 116
- 188 Inverness Ct Unit 113
- 180 Inverness Ct Unit 118
- 180 Inverness Ct Unit 117
- 190 Inverness Ct Unit A
- 190 Inverness Ct Unit 112
- 190 Inverness Ct Unit 111
- 170 Inverness Ct Unit 121
- 170 Inverness Ct Unit 122
- 170 Inverness Ct Unit 170
- 170 Inverness Ct
- 170 Inverness Ct Unit 2
- 170 Inverness Ct Unit A
- 170 Inverness Ct Unit 1
- 168 Inverness Ct Unit 123
- 168 Inverness Ct Unit 168
- 168 Inverness Ct Unit 3
- 259 University Ln Unit 106