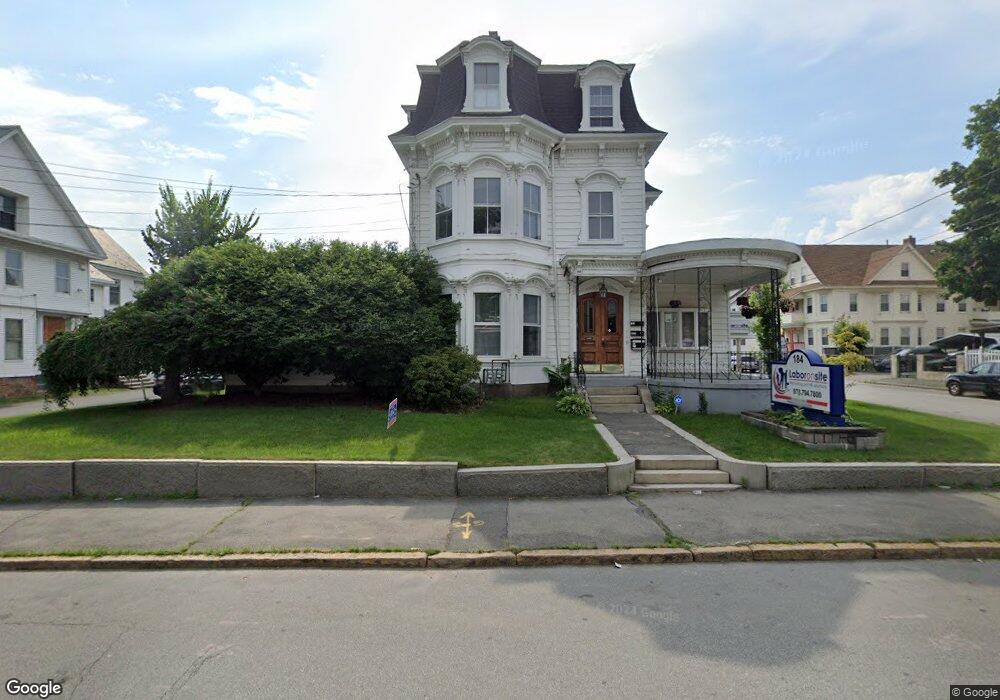
184 Jackson St Lawrence, MA 01841
Arlington NeighborhoodEstimated Value: $722,299
2
Beds
4
Baths
9,519
Sq Ft
$76/Sq Ft
Est. Value
About This Home
This home is located at 184 Jackson St, Lawrence, MA 01841 and is currently estimated at $722,299, approximately $75 per square foot. 184 Jackson St is a home located in Essex County with nearby schools including School For Exceptional Studies and Esperanza Academy School of Hope.
Ownership History
Date
Name
Owned For
Owner Type
Purchase Details
Closed on
Oct 1, 2018
Sold by
Cedar Real Estate Corp
Bought by
184 Jackson St Llc
Current Estimated Value
Home Financials for this Owner
Home Financials are based on the most recent Mortgage that was taken out on this home.
Original Mortgage
$370,000
Outstanding Balance
$322,662
Interest Rate
4.5%
Mortgage Type
New Conventional
Estimated Equity
$397,365
Purchase Details
Closed on
Aug 8, 2017
Sold by
Jozak Jerome A
Bought by
Cedar Real Estate Corp
Home Financials for this Owner
Home Financials are based on the most recent Mortgage that was taken out on this home.
Original Mortgage
$270,000
Interest Rate
3.9%
Mortgage Type
Commercial
Purchase Details
Closed on
Apr 21, 2011
Sold by
Jozak Jerome A
Bought by
Lawrence City Of
Create a Home Valuation Report for This Property
The Home Valuation Report is an in-depth analysis detailing your home's value as well as a comparison with similar homes in the area
Home Values in the Area
Average Home Value in this Area
Purchase History
| Date | Buyer | Sale Price | Title Company |
|---|---|---|---|
| 184 Jackson St Llc | $465,000 | -- | |
| Cedar Real Estate Corp | $300,000 | -- | |
| Lawrence City Of | $26,787 | -- |
Source: Public Records
Mortgage History
| Date | Status | Borrower | Loan Amount |
|---|---|---|---|
| Open | 184 Jackson St Llc | $370,000 | |
| Previous Owner | Cedar Real Estate Corp | $270,000 | |
| Previous Owner | Lawrence City Of | $150,000 |
Source: Public Records
Tax History
| Year | Tax Paid | Tax Assessment Tax Assessment Total Assessment is a certain percentage of the fair market value that is determined by local assessors to be the total taxable value of land and additions on the property. | Land | Improvement |
|---|---|---|---|---|
| 2025 | -- | $827,500 | $268,800 | $558,700 |
| 2024 | -- | $700,200 | $229,800 | $470,400 |
| 2023 | $0 | $602,700 | $192,000 | $410,700 |
| 2022 | $0 | $512,100 | $173,800 | $338,300 |
| 2021 | $0 | $460,200 | $154,200 | $306,000 |
| 2020 | $0 | $446,800 | $151,200 | $295,600 |
| 2019 | $0 | $443,900 | $147,600 | $296,300 |
| 2018 | $0 | $443,600 | $127,000 | $316,600 |
| 2017 | $0 | $428,000 | $111,400 | $316,600 |
| 2016 | -- | $455,500 | $106,000 | $349,500 |
| 2015 | $10,583 | $455,500 | $106,000 | $349,500 |
Source: Public Records
Map
Nearby Homes
- 192 Union St
- 131A Lawrence St Unit 40
- 89 Newbury St Unit 89B
- 94 Summer St
- 7-9 Bennington St
- 32 Orchard St
- 144 Ferry St
- 169 Berkeley St
- 11 Lawrence St Unit 606
- 39 Swan Ave
- 2 Leslie St
- 24 Court St
- 46 Amesbury St Unit 2B
- 46 Amesbury St Unit 4D
- 80 Ferry St Unit 80A
- 434-438 Hampshire St
- 27 Willow St Unit A
- 106 Leroy Ave
- 2 Oak Knoll Rd
- 19-21 Pleasant Terrace
- 180 Jackson St
- 190 Jackson St
- 15 Kendrick St Unit 17
- 15-17 Kendrick St
- 72 Belmont St
- 70 Belmont St
- 21 Kendrick St
- 64 Belmont St Unit 66
- 23 Kendrick St
- 57 Belmont St
- 57 Belmont St Unit 3
- 194 Jackson St
- 176 Jackson St
- 60 Belmont St Unit 62
- 237 Jackson St
- 64-66 Belmont St
- 235 Jackson St Unit 2
- 235 Jackson St
- 53 Belmont St
- 239 Jackson St