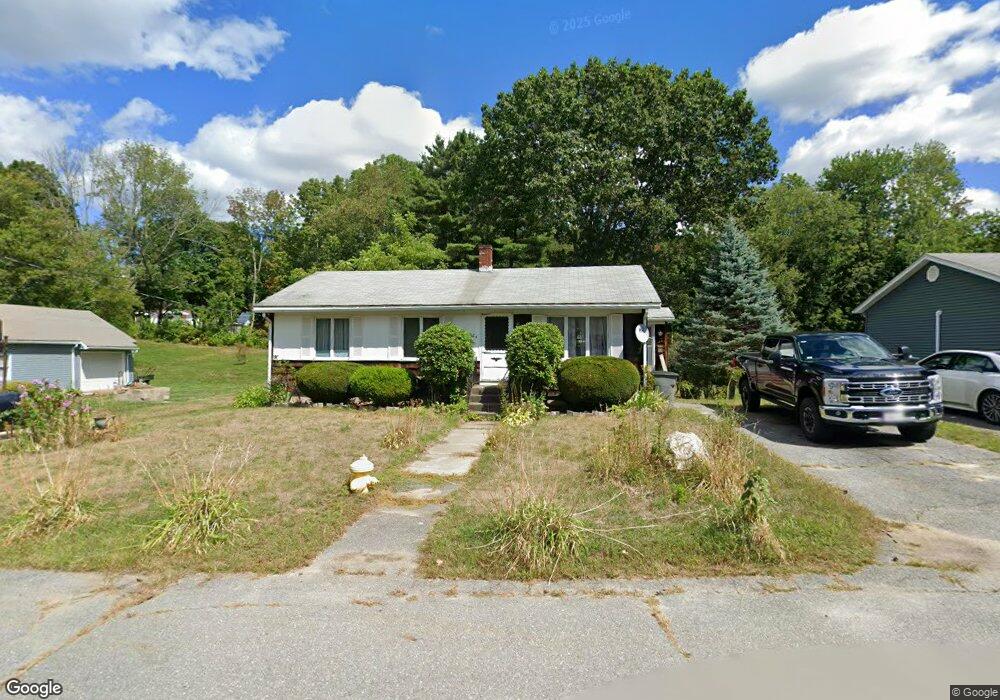
184 Leamy St Gardner, MA 01440
Estimated Value: $334,912 - $374,000
3
Beds
1
Bath
672
Sq Ft
$519/Sq Ft
Est. Value
About This Home
This home is located at 184 Leamy St, Gardner, MA 01440 and is currently estimated at $348,978, approximately $519 per square foot. 184 Leamy St is a home located in Worcester County with nearby schools including Gardner High School and Holy Family Academy.
Ownership History
Date
Name
Owned For
Owner Type
Purchase Details
Closed on
Mar 24, 2000
Sold by
Seppa Richard K and Seppa Judith E
Bought by
Surett Ronald N and Davis Veronica M
Current Estimated Value
Home Financials for this Owner
Home Financials are based on the most recent Mortgage that was taken out on this home.
Original Mortgage
$92,400
Interest Rate
8.31%
Mortgage Type
Purchase Money Mortgage
Purchase Details
Closed on
Dec 23, 1996
Sold by
Rafalski Aline A
Bought by
Seppa Richard K
Create a Home Valuation Report for This Property
The Home Valuation Report is an in-depth analysis detailing your home's value as well as a comparison with similar homes in the area
Home Values in the Area
Average Home Value in this Area
Purchase History
| Date | Buyer | Sale Price | Title Company |
|---|---|---|---|
| Surett Ronald N | $115,500 | -- | |
| Seppa Richard K | $77,000 | -- |
Source: Public Records
Mortgage History
| Date | Status | Borrower | Loan Amount |
|---|---|---|---|
| Open | Seppa Richard K | $123,500 | |
| Closed | Seppa Richard K | $92,400 | |
| Closed | Seppa Richard K | $23,100 | |
| Previous Owner | Seppa Richard K | $71,000 |
Source: Public Records
Tax History Compared to Growth
Tax History
| Year | Tax Paid | Tax Assessment Tax Assessment Total Assessment is a certain percentage of the fair market value that is determined by local assessors to be the total taxable value of land and additions on the property. | Land | Improvement |
|---|---|---|---|---|
| 2025 | $41 | $285,400 | $68,000 | $217,400 |
| 2024 | $3,984 | $265,800 | $61,800 | $204,000 |
| 2023 | $3,691 | $228,800 | $60,900 | $167,900 |
| 2022 | $3,389 | $182,300 | $46,100 | $136,200 |
| 2021 | $3,297 | $164,500 | $40,100 | $124,400 |
| 2020 | $3,154 | $159,800 | $40,100 | $119,700 |
| 2019 | $2,973 | $147,600 | $40,100 | $107,500 |
| 2018 | $2,824 | $139,300 | $40,100 | $99,200 |
| 2017 | $2,761 | $134,800 | $40,100 | $94,700 |
| 2016 | $2,637 | $128,800 | $40,100 | $88,700 |
| 2015 | $2,501 | $125,200 | $40,100 | $85,100 |
| 2014 | $2,400 | $127,200 | $44,500 | $82,700 |
Source: Public Records
Map
Nearby Homes