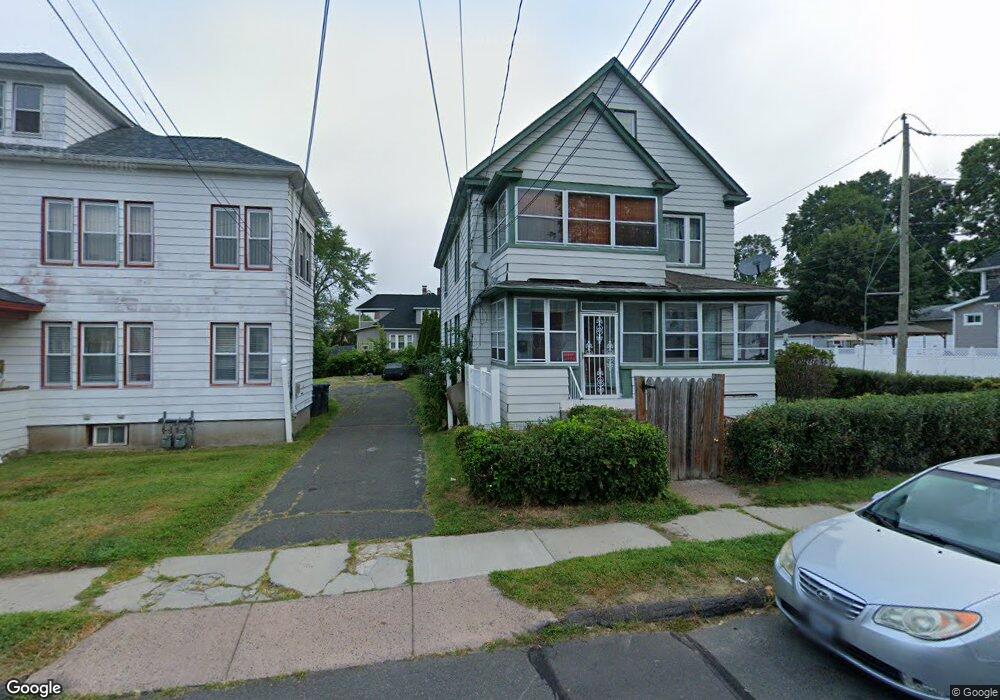
184 Linnmoore St Unit 186 Hartford, CT 06114
South West NeighborhoodEstimated Value: $293,890 - $490,000
4
Beds
2
Baths
2,443
Sq Ft
$160/Sq Ft
Est. Value
About This Home
This home is located at 184 Linnmoore St Unit 186, Hartford, CT 06114 and is currently estimated at $390,723, approximately $159 per square foot. 184 Linnmoore St Unit 186 is a home located in Hartford County with nearby schools including Kennelly School, Environmental Sciences Magnet School at Mary Hooker, and Sanchez School.
Ownership History
Date
Name
Owned For
Owner Type
Purchase Details
Closed on
Feb 5, 2015
Sold by
Quintana Heriberto
Bought by
Martinez Lucy G
Current Estimated Value
Purchase Details
Closed on
Jun 28, 2002
Sold by
Douglas Anthony and Douglas Cynthia
Bought by
Martinez Lucy and Quintana Herbesto
Home Financials for this Owner
Home Financials are based on the most recent Mortgage that was taken out on this home.
Original Mortgage
$142,400
Interest Rate
6.92%
Mortgage Type
Purchase Money Mortgage
Purchase Details
Closed on
Sep 1, 1987
Sold by
Rosario Victor
Bought by
Scalise Fran
Home Financials for this Owner
Home Financials are based on the most recent Mortgage that was taken out on this home.
Original Mortgage
$135,000
Interest Rate
10.24%
Mortgage Type
Purchase Money Mortgage
Create a Home Valuation Report for This Property
The Home Valuation Report is an in-depth analysis detailing your home's value as well as a comparison with similar homes in the area
Home Values in the Area
Average Home Value in this Area
Purchase History
| Date | Buyer | Sale Price | Title Company |
|---|---|---|---|
| Martinez Lucy G | -- | -- | |
| Martinez Lucy | $170,000 | -- | |
| Scalise Fran | $10,000 | -- |
Source: Public Records
Mortgage History
| Date | Status | Borrower | Loan Amount |
|---|---|---|---|
| Previous Owner | Scalise Fran | $142,400 | |
| Previous Owner | Scalise Fran | $135,000 |
Source: Public Records
Tax History Compared to Growth
Tax History
| Year | Tax Paid | Tax Assessment Tax Assessment Total Assessment is a certain percentage of the fair market value that is determined by local assessors to be the total taxable value of land and additions on the property. | Land | Improvement |
|---|---|---|---|---|
| 2025 | $5,240 | $75,999 | $7,607 | $68,392 |
| 2024 | $5,240 | $75,999 | $7,607 | $68,392 |
| 2023 | $5,240 | $75,999 | $7,607 | $68,392 |
| 2022 | $4,202 | $75,999 | $7,607 | $68,392 |
| 2021 | $4,202 | $56,560 | $10,465 | $46,095 |
| 2020 | $4,202 | $56,560 | $10,465 | $46,095 |
| 2019 | $4,202 | $56,560 | $10,465 | $46,095 |
| 2018 | $4,060 | $54,653 | $10,112 | $44,541 |
| 2016 | $4,755 | $64,001 | $9,631 | $54,370 |
| 2015 | $4,529 | $60,961 | $9,173 | $51,788 |
| 2014 | $4,418 | $59,471 | $8,949 | $50,522 |
Source: Public Records
Map
Nearby Homes
- 90 Salem St
- 148 Princeton St
- 405 W Preston St Unit 407
- 147 Newbury St Unit 149
- 111 Harvard St
- 510 New Britain Ave
- 634 New Britain Ave
- 647 Broadview Terrace
- 107 Amherst St
- 136 Amherst St
- 326 South St Unit 328
- 90 Harwich St Unit 92
- 60 Coolidge St
- 25 Cumberland St
- 87 Grandview Terrace Unit 89
- 281 Brown St
- 46 Arlington St Unit 48
- 89 Sequin St
- 111 Coolidge St
- 49 Newbury St Unit 51
- 188 Linnmoore St Unit 190
- 180 Linnmoore St Unit 182
- 194 Linnmoore St
- 231 Monroe St
- 174 Linnmoore St
- 198 Linnmoore St
- 181 Linnmoore St
- 227 Monroe St
- 170 Linnmoore St
- 202 Linnmoore St
- 177 Linnmoore St
- 185 Linnmoore St
- 173 Linnmoore St
- 189 Linnmoore St
- 169 Linnmoore St
- 221 Monroe St
- 230 Monroe St
- 166 Linnmoore St
- 204 Linnmoore St Unit 206
- 602 Hillside Ave Unit 604