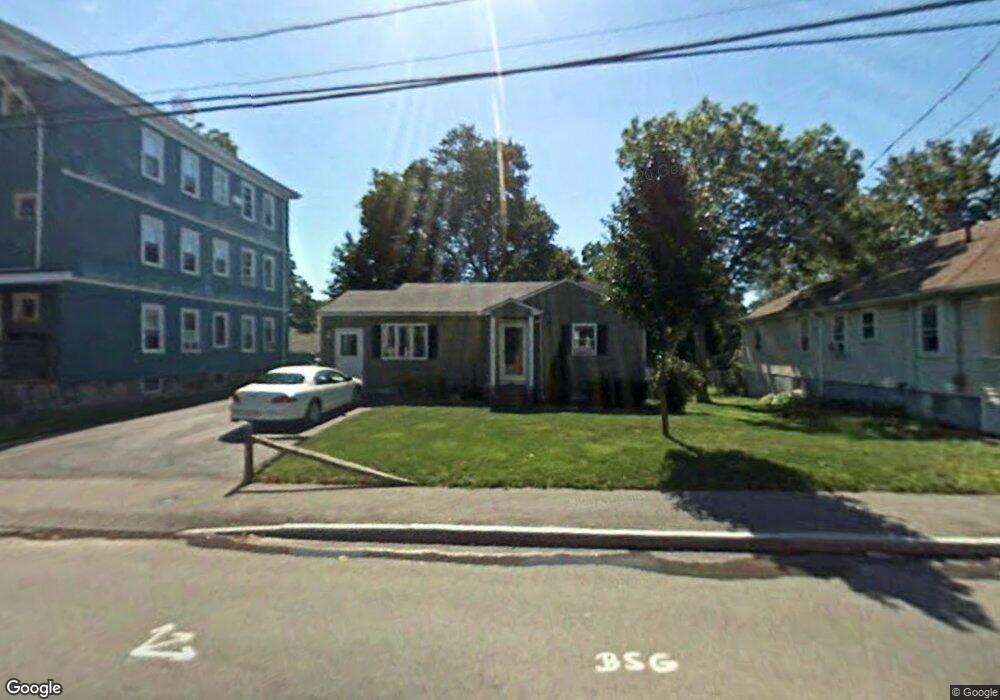
184 Menlo St Brockton, MA 02301
Clifton Heights NeighborhoodEstimated Value: $389,000 - $407,311
2
Beds
1
Bath
800
Sq Ft
$496/Sq Ft
Est. Value
About This Home
This home is located at 184 Menlo St, Brockton, MA 02301 and is currently estimated at $396,578, approximately $495 per square foot. 184 Menlo St is a home located in Plymouth County with nearby schools including John F. Kennedy Elementary School, Davis K-8 School, and South Middle School.
Ownership History
Date
Name
Owned For
Owner Type
Purchase Details
Closed on
Mar 1, 1999
Sold by
Towne Charles J and Towne Teresa L
Bought by
Costello Thomas M
Current Estimated Value
Home Financials for this Owner
Home Financials are based on the most recent Mortgage that was taken out on this home.
Original Mortgage
$85,400
Interest Rate
6.78%
Mortgage Type
Purchase Money Mortgage
Purchase Details
Closed on
Feb 5, 1988
Sold by
Carchia Florence M
Bought by
Towne Charles J
Home Financials for this Owner
Home Financials are based on the most recent Mortgage that was taken out on this home.
Original Mortgage
$92,000
Interest Rate
10.6%
Mortgage Type
Purchase Money Mortgage
Create a Home Valuation Report for This Property
The Home Valuation Report is an in-depth analysis detailing your home's value as well as a comparison with similar homes in the area
Home Values in the Area
Average Home Value in this Area
Purchase History
| Date | Buyer | Sale Price | Title Company |
|---|---|---|---|
| Costello Thomas M | $89,900 | -- | |
| Towne Charles J | $115,000 | -- |
Source: Public Records
Mortgage History
| Date | Status | Borrower | Loan Amount |
|---|---|---|---|
| Open | Towne Charles J | $89,700 | |
| Closed | Towne Charles J | $85,400 | |
| Previous Owner | Towne Charles J | $62,000 | |
| Previous Owner | Towne Charles J | $92,000 |
Source: Public Records
Tax History Compared to Growth
Tax History
| Year | Tax Paid | Tax Assessment Tax Assessment Total Assessment is a certain percentage of the fair market value that is determined by local assessors to be the total taxable value of land and additions on the property. | Land | Improvement |
|---|---|---|---|---|
| 2025 | $4,253 | $351,200 | $140,000 | $211,200 |
| 2024 | $4,147 | $345,000 | $140,000 | $205,000 |
| 2023 | $4,016 | $309,400 | $104,100 | $205,300 |
| 2022 | $3,738 | $267,600 | $94,600 | $173,000 |
| 2021 | $3,336 | $230,100 | $78,600 | $151,500 |
| 2020 | $3,159 | $208,500 | $73,600 | $134,900 |
| 2019 | $3,284 | $211,300 | $71,800 | $139,500 |
| 2018 | $3,088 | $192,300 | $71,800 | $120,500 |
| 2017 | $2,447 | $152,000 | $71,800 | $80,200 |
| 2016 | $2,328 | $134,100 | $69,600 | $64,500 |
| 2015 | $2,202 | $121,300 | $69,600 | $51,700 |
| 2014 | $2,228 | $122,900 | $69,600 | $53,300 |
Source: Public Records
Map
Nearby Homes