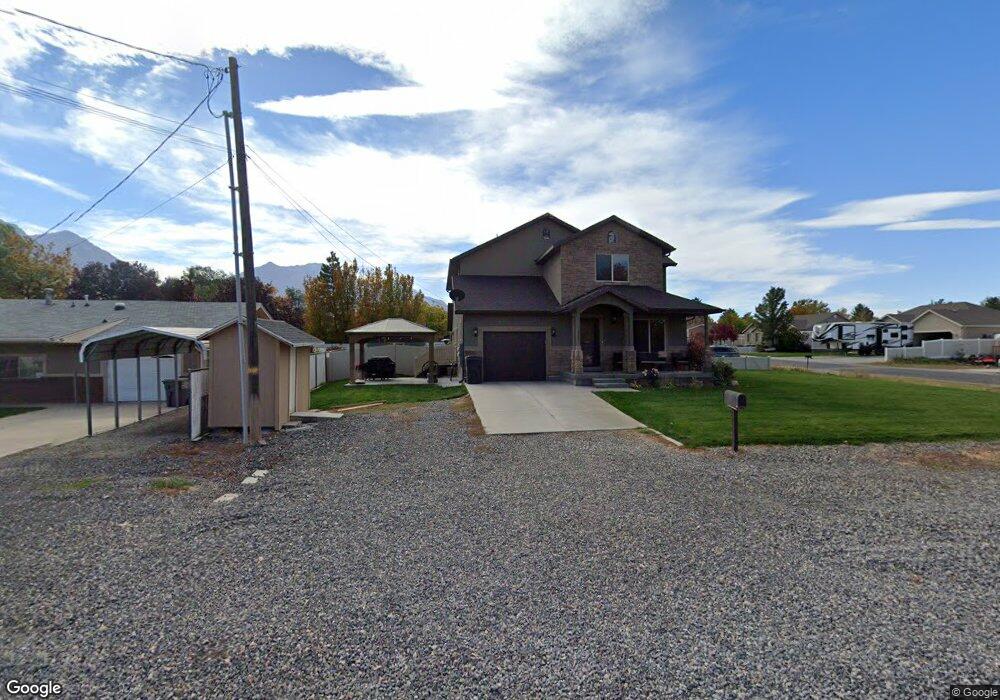
184 N 100 E Unit 2 Santaquin, UT 84655
Estimated Value: $372,676 - $430,000
3
Beds
3
Baths
2,236
Sq Ft
$175/Sq Ft
Est. Value
About This Home
This home is located at 184 N 100 E Unit 2, Santaquin, UT 84655 and is currently estimated at $390,419, approximately $174 per square foot. 184 N 100 E Unit 2 is a home located in Utah County with nearby schools including Apple Valley Elementary, Payson Junior High School, and Mt. Nebo Middle.
Ownership History
Date
Name
Owned For
Owner Type
Purchase Details
Closed on
Dec 29, 2023
Sold by
House Jessie and House Natalie
Bought by
House Natalie
Current Estimated Value
Purchase Details
Closed on
Aug 17, 2021
Sold by
House Natalie and Wall Natalie C
Bought by
House Jessie and House Natalie
Home Financials for this Owner
Home Financials are based on the most recent Mortgage that was taken out on this home.
Original Mortgage
$283,900
Interest Rate
2.9%
Mortgage Type
New Conventional
Purchase Details
Closed on
Jul 11, 2014
Sold by
Roberts Glen W
Bought by
Wall Natalie C
Home Financials for this Owner
Home Financials are based on the most recent Mortgage that was taken out on this home.
Original Mortgage
$172,448
Interest Rate
4.07%
Mortgage Type
New Conventional
Create a Home Valuation Report for This Property
The Home Valuation Report is an in-depth analysis detailing your home's value as well as a comparison with similar homes in the area
Home Values in the Area
Average Home Value in this Area
Purchase History
| Date | Buyer | Sale Price | Title Company |
|---|---|---|---|
| House Natalie | -- | First American Title | |
| House Jessie | -- | First American Title | |
| House Jessie | -- | Wasatch Land & Title | |
| Wall Natalie C | -- | Title West |
Source: Public Records
Mortgage History
| Date | Status | Borrower | Loan Amount |
|---|---|---|---|
| Previous Owner | House Jessie | $283,900 | |
| Previous Owner | Wall Natalie C | $172,448 |
Source: Public Records
Tax History
| Year | Tax Paid | Tax Assessment Tax Assessment Total Assessment is a certain percentage of the fair market value that is determined by local assessors to be the total taxable value of land and additions on the property. | Land | Improvement |
|---|---|---|---|---|
| 2025 | $2,163 | $202,950 | -- | -- |
| 2024 | $2,163 | $215,435 | $0 | $0 |
| 2023 | $2,184 | $218,185 | $0 | $0 |
| 2022 | $2,028 | $209,000 | $0 | $0 |
| 2021 | $1,634 | $261,000 | $48,200 | $212,800 |
| 2020 | $1,562 | $241,700 | $48,200 | $193,500 |
| 2019 | $1,440 | $228,000 | $48,200 | $179,800 |
| 2018 | $1,321 | $199,400 | $48,200 | $151,200 |
| 2017 | $1,360 | $109,670 | $0 | $0 |
| 2016 | $1,225 | $96,800 | $0 | $0 |
| 2015 | $1,192 | $92,400 | $0 | $0 |
| 2014 | $632 | $48,895 | $0 | $0 |
Source: Public Records
Map
Nearby Homes
Your Personal Tour Guide
Ask me questions while you tour the home.