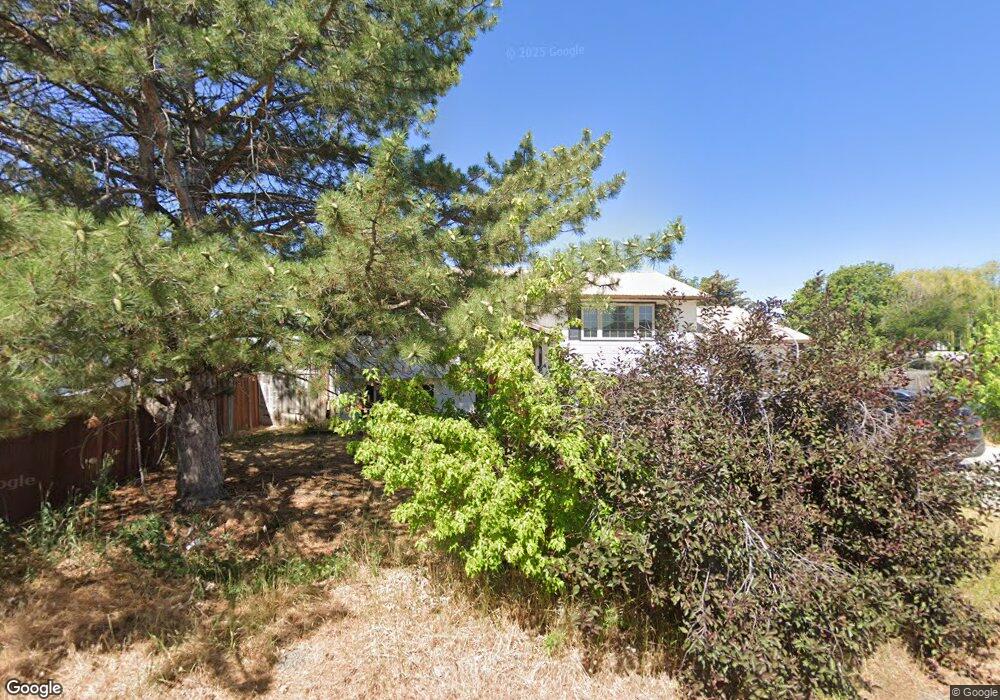
184 N 680 W Blackfoot, ID 83221
Estimated Value: $293,000 - $399,000
3
Beds
1
Bath
1,903
Sq Ft
$173/Sq Ft
Est. Value
About This Home
This home is located at 184 N 680 W, Blackfoot, ID 83221 and is currently estimated at $328,710, approximately $172 per square foot. 184 N 680 W is a home with nearby schools including Moreland Elementary School, Riverside Elementary School, and Rockford Elementary School.
Ownership History
Date
Name
Owned For
Owner Type
Purchase Details
Closed on
Oct 17, 2019
Sold by
Mitchell Bryan W
Bought by
Mitchell Bryan W and Mitchell Stephanie D
Current Estimated Value
Home Financials for this Owner
Home Financials are based on the most recent Mortgage that was taken out on this home.
Original Mortgage
$243,750
Outstanding Balance
$109,609
Interest Rate
3.4%
Mortgage Type
Commercial
Estimated Equity
$219,101
Purchase Details
Closed on
Feb 2, 2007
Sold by
Hawkes Tina M
Bought by
Mitchell Bryan W
Create a Home Valuation Report for This Property
The Home Valuation Report is an in-depth analysis detailing your home's value as well as a comparison with similar homes in the area
Home Values in the Area
Average Home Value in this Area
Purchase History
| Date | Buyer | Sale Price | Title Company |
|---|---|---|---|
| Mitchell Bryan W | -- | Alliance Title Blackfoot Off | |
| Mitchell Bryan W | -- | -- |
Source: Public Records
Mortgage History
| Date | Status | Borrower | Loan Amount |
|---|---|---|---|
| Open | Mitchell Bryan W | $243,750 |
Source: Public Records
Tax History Compared to Growth
Tax History
| Year | Tax Paid | Tax Assessment Tax Assessment Total Assessment is a certain percentage of the fair market value that is determined by local assessors to be the total taxable value of land and additions on the property. | Land | Improvement |
|---|---|---|---|---|
| 2025 | $1,884 | $277,565 | $60,000 | $217,565 |
| 2024 | $1,884 | $264,565 | $47,000 | $217,565 |
| 2023 | $1,960 | $264,565 | $47,000 | $217,565 |
| 2022 | $3,051 | $190,135 | $47,000 | $143,135 |
| 2021 | $2,170 | $156,465 | $32,000 | $124,465 |
| 2020 | $1,880 | $121,084 | $0 | $0 |
| 2019 | $1,993 | $121,084 | $0 | $0 |
| 2018 | $1,789 | $99,300 | $21,500 | $77,800 |
| 2017 | $1,735 | $94,500 | $16,700 | $77,800 |
| 2016 | $1,722 | $94,500 | $0 | $0 |
| 2015 | $1,562 | $94,500 | $0 | $0 |
| 2014 | $1,562 | $94,500 | $16,700 | $77,800 |
Source: Public Records
Map
Nearby Homes