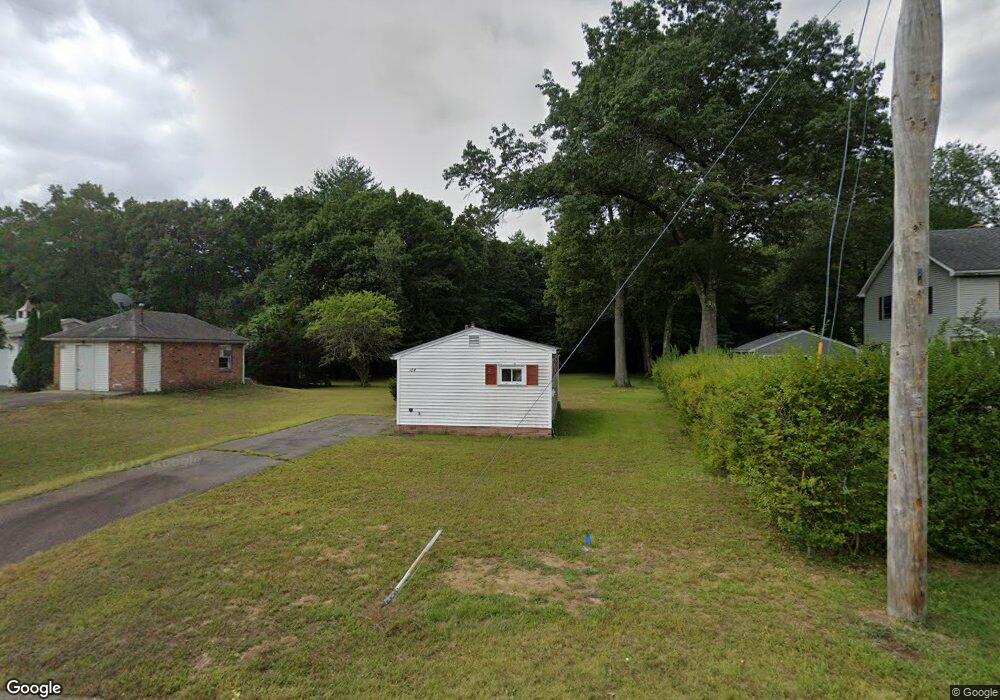
184 Old Lyman Rd Chicopee, MA 01020
Fairview NeighborhoodEstimated Value: $206,000 - $251,837
1
Bed
1
Bath
416
Sq Ft
$549/Sq Ft
Est. Value
About This Home
This home is located at 184 Old Lyman Rd, Chicopee, MA 01020 and is currently estimated at $228,209, approximately $548 per square foot. 184 Old Lyman Rd is a home located in Hampden County with nearby schools including Bowie Elementary School, Fairview Middle School, and Chicopee Comprehensive High School.
Ownership History
Date
Name
Owned For
Owner Type
Purchase Details
Closed on
Dec 6, 2007
Sold by
Menard Carol A and Menard Robert E
Bought by
Menard James R
Current Estimated Value
Home Financials for this Owner
Home Financials are based on the most recent Mortgage that was taken out on this home.
Original Mortgage
$58,500
Outstanding Balance
$37,162
Interest Rate
6.37%
Estimated Equity
$191,047
Create a Home Valuation Report for This Property
The Home Valuation Report is an in-depth analysis detailing your home's value as well as a comparison with similar homes in the area
Home Values in the Area
Average Home Value in this Area
Purchase History
| Date | Buyer | Sale Price | Title Company |
|---|---|---|---|
| Menard James R | $65,000 | -- |
Source: Public Records
Mortgage History
| Date | Status | Borrower | Loan Amount |
|---|---|---|---|
| Open | Menard James R | $58,500 |
Source: Public Records
Tax History
| Year | Tax Paid | Tax Assessment Tax Assessment Total Assessment is a certain percentage of the fair market value that is determined by local assessors to be the total taxable value of land and additions on the property. | Land | Improvement |
|---|---|---|---|---|
| 2025 | $2,718 | $179,300 | $130,100 | $49,200 |
| 2024 | $2,589 | $175,400 | $127,700 | $47,700 |
| 2023 | $2,429 | $160,300 | $116,200 | $44,100 |
| 2022 | $2,338 | $137,600 | $100,800 | $36,800 |
| 2021 | $2,208 | $125,400 | $91,700 | $33,700 |
| 2020 | $2,193 | $125,600 | $94,200 | $31,400 |
| 2019 | $2,214 | $123,300 | $94,200 | $29,100 |
| 2018 | $2,205 | $120,400 | $89,800 | $30,600 |
| 2017 | $1,804 | $104,200 | $82,200 | $22,000 |
| 2016 | $1,760 | $104,100 | $82,200 | $21,900 |
| 2015 | $2,007 | $114,400 | $82,200 | $32,200 |
| 2014 | $1,003 | $114,400 | $82,200 | $32,200 |
Source: Public Records
Map
Nearby Homes
- 90 Anson St
- 128 Ann St
- 143 Royal St
- 18 Devlin Dr
- 61 Saint Jacques Ave
- 15 Hudson Ave
- 1709 Memorial Dr
- 81 Mccarthy Ave
- 117 Andersen Rd
- 1181 James St
- 523 James St
- 56 Old Lyman Rd
- 41 Susan Ave
- 20 Lyman Terrace
- 104 Johnson Rd Unit 1103
- 104 Johnson Rd Unit 707
- 84 Montcalm St
- 28 New Ludlow Rd
- 35 Ludlow Rd
- 0 Granby Rd
- 174 Old Lyman Rd
- 192 Old Lyman Rd
- 189 Old Lyman Rd
- 201 Old Lyman Rd
- 177 Old Lyman Rd
- 164 Old Lyman Rd
- 202 Old Lyman Rd
- 171 Old Lyman Rd
- 209 Old Lyman Rd
- 155 Old Lyman Rd
- 212 Old Lyman Rd
- 213 Old Lyman Rd
- 145 Old Lyman Rd
- 142 Old Lyman Rd
- 152 Old Lyman Rd
- 135 Old Lyman Rd
- 234 Old Lyman Rd
- 732 Britton St
- 222 Old Lyman Rd
- 125 Old Lyman Rd
Your Personal Tour Guide
Ask me questions while you tour the home.