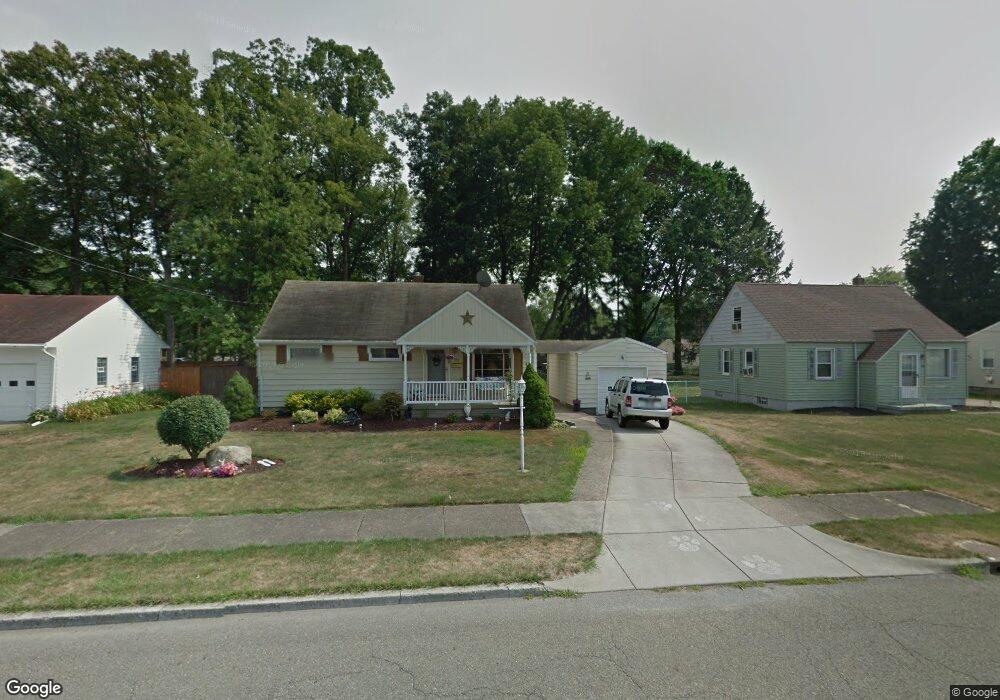
184 Omar St Struthers, OH 44471
Estimated Value: $124,025 - $154,000
3
Beds
1
Bath
1,057
Sq Ft
$136/Sq Ft
Est. Value
About This Home
This home is located at 184 Omar St, Struthers, OH 44471 and is currently estimated at $143,256, approximately $135 per square foot. 184 Omar St is a home located in Mahoning County with nearby schools including Struthers Elementary School, Struthers Middle School, and Struthers High School.
Ownership History
Date
Name
Owned For
Owner Type
Purchase Details
Closed on
Jan 29, 2024
Sold by
Carbon Patricia A
Bought by
Carbon Andrew and Carbon Carly
Current Estimated Value
Home Financials for this Owner
Home Financials are based on the most recent Mortgage that was taken out on this home.
Original Mortgage
$85,000
Outstanding Balance
$83,194
Interest Rate
6.95%
Mortgage Type
New Conventional
Estimated Equity
$60,062
Purchase Details
Closed on
Jul 24, 2003
Sold by
The Gordon Family Trust and Gordon John J
Bought by
Carbon Patricia A
Home Financials for this Owner
Home Financials are based on the most recent Mortgage that was taken out on this home.
Original Mortgage
$64,800
Interest Rate
5.3%
Mortgage Type
Purchase Money Mortgage
Purchase Details
Closed on
Jun 27, 2001
Sold by
Gordon John James and Gordon Bonnie J
Bought by
Gordon John James and Gordon Bonnie J
Purchase Details
Closed on
May 19, 1960
Bought by
Gordon John J and B J
Create a Home Valuation Report for This Property
The Home Valuation Report is an in-depth analysis detailing your home's value as well as a comparison with similar homes in the area
Home Values in the Area
Average Home Value in this Area
Purchase History
| Date | Buyer | Sale Price | Title Company |
|---|---|---|---|
| Carbon Andrew | $100,000 | None Listed On Document | |
| Carbon Patricia A | $72,000 | -- | |
| Gordon John James | -- | -- | |
| Gordon John J | -- | -- |
Source: Public Records
Mortgage History
| Date | Status | Borrower | Loan Amount |
|---|---|---|---|
| Open | Carbon Andrew | $85,000 | |
| Previous Owner | Carbon Patricia A | $64,800 |
Source: Public Records
Tax History
| Year | Tax Paid | Tax Assessment Tax Assessment Total Assessment is a certain percentage of the fair market value that is determined by local assessors to be the total taxable value of land and additions on the property. | Land | Improvement |
|---|---|---|---|---|
| 2025 | $1,398 | $33,560 | $3,140 | $30,420 |
| 2024 | $1,398 | $33,560 | $3,140 | $30,420 |
| 2023 | $1,374 | $33,560 | $3,140 | $30,420 |
| 2022 | $1,058 | $19,550 | $2,950 | $16,600 |
| 2021 | $1,048 | $19,550 | $2,950 | $16,600 |
| 2020 | $1,053 | $19,550 | $2,950 | $16,600 |
| 2019 | $1,009 | $17,000 | $2,570 | $14,430 |
| 2018 | $963 | $17,000 | $2,570 | $14,430 |
| 2017 | $1,050 | $17,000 | $2,570 | $14,430 |
| 2016 | $1,141 | $20,690 | $3,000 | $17,690 |
| 2015 | $1,114 | $20,690 | $3,000 | $17,690 |
| 2014 | $1,118 | $20,690 | $3,000 | $17,690 |
| 2013 | $1,039 | $20,690 | $3,000 | $17,690 |
Source: Public Records
Map
Nearby Homes
Your Personal Tour Guide
Ask me questions while you tour the home.