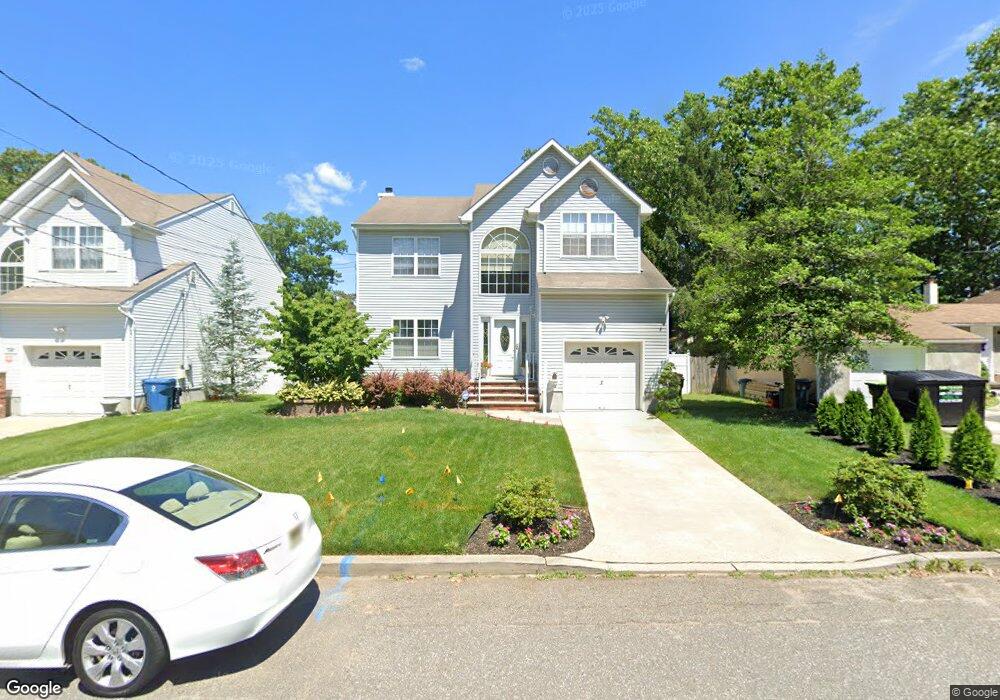
184 Park Ave Old Bridge, NJ 08857
Estimated Value: $543,000 - $652,000
--
Bed
--
Bath
1,799
Sq Ft
$331/Sq Ft
Est. Value
About This Home
This home is located at 184 Park Ave, Old Bridge, NJ 08857 and is currently estimated at $595,924, approximately $331 per square foot. 184 Park Ave is a home located in Middlesex County with nearby schools including Old Bridge High School, Hatikvah International Charter School, and Calvary Christian School.
Ownership History
Date
Name
Owned For
Owner Type
Purchase Details
Closed on
Sep 6, 2002
Sold by
Poole Mark
Bought by
Rivera Cynthia and Rodriguez Ruben
Current Estimated Value
Home Financials for this Owner
Home Financials are based on the most recent Mortgage that was taken out on this home.
Original Mortgage
$223,900
Interest Rate
6.09%
Purchase Details
Closed on
Jan 14, 1999
Sold by
Dej Builders
Bought by
Poole Mark and Poole Chie
Home Financials for this Owner
Home Financials are based on the most recent Mortgage that was taken out on this home.
Original Mortgage
$174,100
Interest Rate
6.74%
Create a Home Valuation Report for This Property
The Home Valuation Report is an in-depth analysis detailing your home's value as well as a comparison with similar homes in the area
Home Values in the Area
Average Home Value in this Area
Purchase History
| Date | Buyer | Sale Price | Title Company |
|---|---|---|---|
| Rivera Cynthia | $279,900 | -- | |
| Poole Mark | $183,369 | -- |
Source: Public Records
Mortgage History
| Date | Status | Borrower | Loan Amount |
|---|---|---|---|
| Previous Owner | Rivera Cynthia | $223,900 | |
| Previous Owner | Poole Mark | $174,100 |
Source: Public Records
Tax History Compared to Growth
Tax History
| Year | Tax Paid | Tax Assessment Tax Assessment Total Assessment is a certain percentage of the fair market value that is determined by local assessors to be the total taxable value of land and additions on the property. | Land | Improvement |
|---|---|---|---|---|
| 2025 | $9,679 | $171,400 | $45,600 | $125,800 |
| 2024 | $9,285 | $171,400 | $45,600 | $125,800 |
| 2023 | $9,285 | $171,400 | $45,600 | $125,800 |
| 2022 | $9,072 | $171,400 | $45,600 | $125,800 |
| 2021 | $6,658 | $171,400 | $45,600 | $125,800 |
| 2020 | $8,805 | $171,400 | $45,600 | $125,800 |
| 2019 | $8,656 | $171,400 | $45,600 | $125,800 |
| 2018 | $8,560 | $171,400 | $45,600 | $125,800 |
| 2017 | $8,282 | $171,400 | $45,600 | $125,800 |
| 2016 | $8,111 | $171,400 | $45,600 | $125,800 |
| 2015 | $7,970 | $171,400 | $45,600 | $125,800 |
| 2014 | $7,890 | $171,400 | $45,600 | $125,800 |
Source: Public Records
Map
Nearby Homes