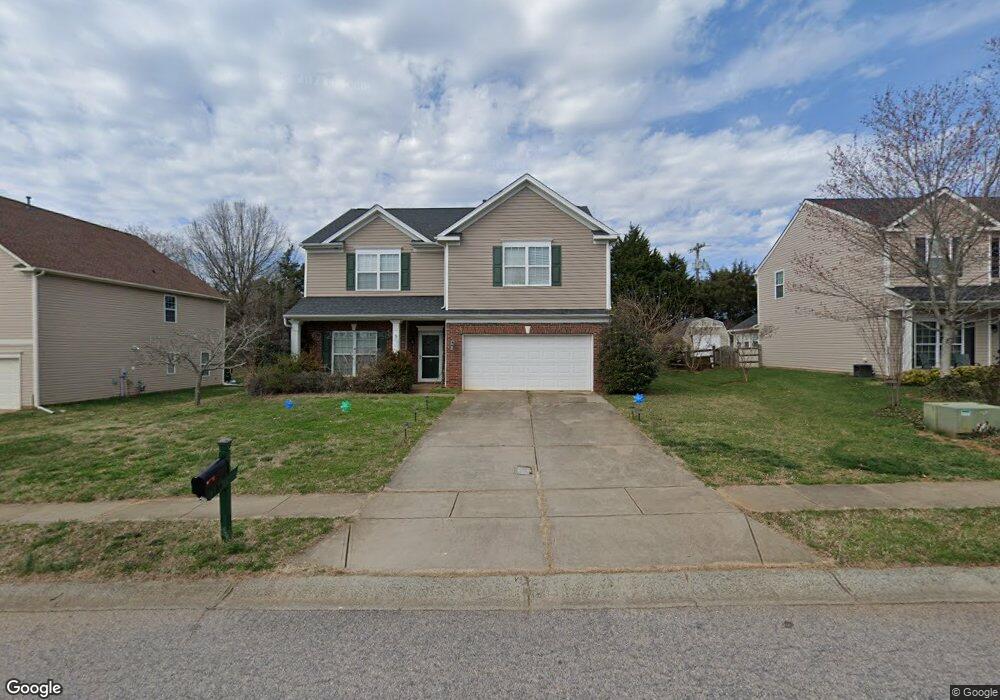
184 Pleasant Grove Ln Mooresville, NC 28115
Estimated Value: $407,708 - $459,000
5
Beds
3
Baths
2,868
Sq Ft
$151/Sq Ft
Est. Value
About This Home
This home is located at 184 Pleasant Grove Ln, Mooresville, NC 28115 and is currently estimated at $433,677, approximately $151 per square foot. 184 Pleasant Grove Ln is a home located in Iredell County with nearby schools including Rocky River Elementary School, East Mooresville Intermediate School, and Mooresville Middle.
Ownership History
Date
Name
Owned For
Owner Type
Purchase Details
Closed on
Mar 7, 2016
Sold by
Wolfpadck Land And Develometn Llc
Bought by
Miller Carol Ann and Miller Carol
Current Estimated Value
Home Financials for this Owner
Home Financials are based on the most recent Mortgage that was taken out on this home.
Original Mortgage
$190,880
Outstanding Balance
$151,780
Interest Rate
3.79%
Mortgage Type
New Conventional
Estimated Equity
$281,897
Purchase Details
Closed on
Nov 2, 2015
Sold by
Secretary Of Veterans Affairs
Bought by
Wolfpack Land & Development Llc
Purchase Details
Closed on
Sep 11, 2015
Sold by
Services Of Carolina Llc
Bought by
Dc Washinton
Purchase Details
Closed on
Nov 10, 2006
Sold by
The Ryland Group Inc
Bought by
Messina Mauro T and Messina Wendy L
Home Financials for this Owner
Home Financials are based on the most recent Mortgage that was taken out on this home.
Original Mortgage
$217,103
Interest Rate
6.27%
Mortgage Type
VA
Create a Home Valuation Report for This Property
The Home Valuation Report is an in-depth analysis detailing your home's value as well as a comparison with similar homes in the area
Home Values in the Area
Average Home Value in this Area
Purchase History
| Date | Buyer | Sale Price | Title Company |
|---|---|---|---|
| Miller Carol Ann | $239,000 | None Available | |
| Wolfpack Land & Development Llc | $195,000 | None Available | |
| Dc Washinton | $179,030 | None Available | |
| Messina Mauro T | $211,000 | None Available |
Source: Public Records
Mortgage History
| Date | Status | Borrower | Loan Amount |
|---|---|---|---|
| Open | Miller Carol Ann | $190,880 | |
| Previous Owner | Messina Mauro T | $217,103 |
Source: Public Records
Tax History Compared to Growth
Tax History
| Year | Tax Paid | Tax Assessment Tax Assessment Total Assessment is a certain percentage of the fair market value that is determined by local assessors to be the total taxable value of land and additions on the property. | Land | Improvement |
|---|---|---|---|---|
| 2024 | $5,344 | $396,800 | $67,000 | $329,800 |
| 2023 | $4,698 | $396,800 | $67,000 | $329,800 |
| 2022 | $3,524 | $257,060 | $35,000 | $222,060 |
| 2021 | $3,524 | $257,060 | $35,000 | $222,060 |
| 2020 | $3,524 | $257,060 | $35,000 | $222,060 |
| 2019 | $3,499 | $257,060 | $35,000 | $222,060 |
| 2018 | $3,009 | $219,520 | $35,000 | $184,520 |
| 2017 | $2,949 | $219,520 | $35,000 | $184,520 |
| 2016 | $2,949 | $219,520 | $35,000 | $184,520 |
| 2015 | $2,949 | $219,520 | $35,000 | $184,520 |
| 2014 | $2,701 | $207,150 | $28,000 | $179,150 |
Source: Public Records
Map
Nearby Homes
- 229 Pleasant Grove Ln
- 210 Golden Valley Dr
- 115 Little Kennerly Dr
- 186 Golden Valley Dr
- 117 Dogwood Village Trail Unit A,B,C,D,E,F
- 0 Pine St Unit CAR4251805
- 154 N King William Dr
- 147 Dubois Dr
- 106 Kirsche Ct
- 115 Goodleigh Ln
- Lot 45 Cook St Unit 46+ PT46
- 147 Kingsway Dr
- 321 Cook St
- 00 Pine St
- 103 Golden Valley Dr
- 128 Edgington St
- 109 Washburn Range Dr
- 116 Kingsway Dr
- 805 Pine St
- 119 Edgington St
- 180 Pleasant Grove Ln
- 188 Pleasant Grove Ln
- 192 Pleasant Grove Ln
- 185 Pleasant Grove Ln
- 181 Pleasant Grove Ln
- 175 Pleasant Grove Ln
- 196 Pleasant Grove Ln
- 174 Pleasant Grove Ln
- 174 Pleasant Grove Ln Unit 26
- 109 Heywatchis Dr
- 167 Pleasant Grove Ln
- 200 Pleasant Grove Ln
- 170 Pleasant Grove Ln
- 109 Whitefield Trace
- 104 Heywatchis Dr
- 113 Whitefield Trace
- 113 Heywatchis Dr
- 108 Heywatchis Dr
- 166 Pleasant Grove Ln
- 163 Pleasant Grove Ln