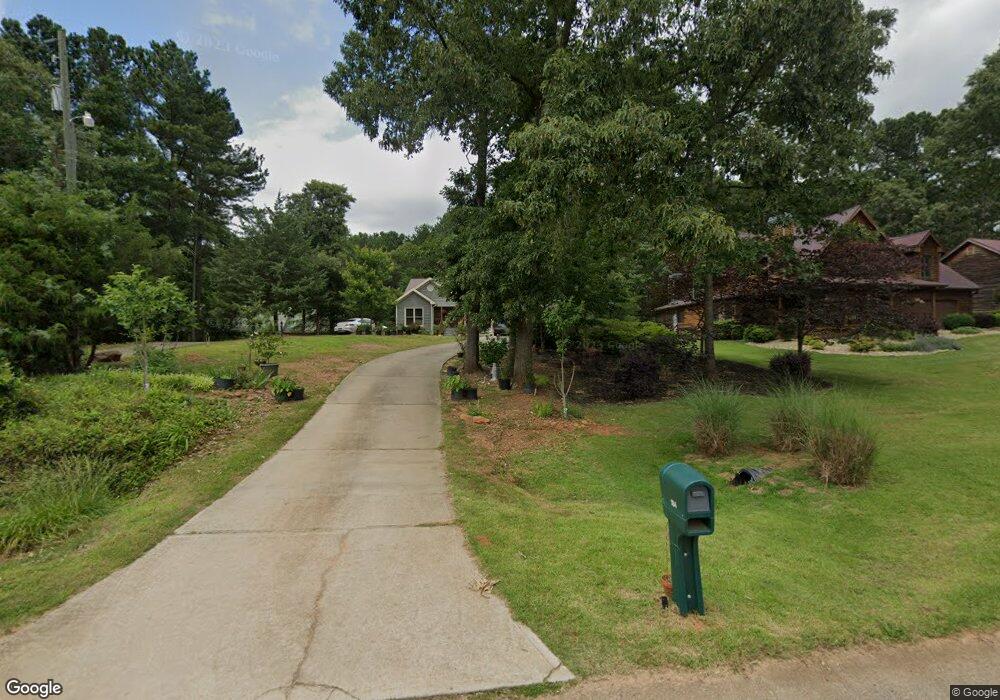
184 Providence Point Ln Unit 12 Hartwell, GA 30643
Estimated Value: $357,952 - $398,000
3
Beds
2
Baths
1,836
Sq Ft
$203/Sq Ft
Est. Value
About This Home
This home is located at 184 Providence Point Ln Unit 12, Hartwell, GA 30643 and is currently estimated at $372,738, approximately $203 per square foot. 184 Providence Point Ln Unit 12 is a home located in Hart County with nearby schools including Hart County High School.
Ownership History
Date
Name
Owned For
Owner Type
Purchase Details
Closed on
Jan 30, 2020
Sold by
Osborne Joshua T
Bought by
Pham The Nhu
Current Estimated Value
Purchase Details
Closed on
Aug 13, 2010
Sold by
Us Bank National Associati
Bought by
Osborne Joshua T
Home Financials for this Owner
Home Financials are based on the most recent Mortgage that was taken out on this home.
Original Mortgage
$154,913
Interest Rate
4.75%
Mortgage Type
FHA
Purchase Details
Closed on
May 4, 2010
Sold by
Bredemeir Haley R
Bought by
Us Bank National Association T
Purchase Details
Closed on
Sep 8, 2006
Sold by
Timberwood Homes Inc
Bought by
Monroe Richard J and Monroe Haley B
Home Financials for this Owner
Home Financials are based on the most recent Mortgage that was taken out on this home.
Original Mortgage
$187,150
Interest Rate
6.52%
Mortgage Type
New Conventional
Purchase Details
Closed on
Sep 29, 2005
Sold by
Christa Frank J and Christa Peggy H
Bought by
Timberwood Homes Inc
Purchase Details
Closed on
Dec 1, 2003
Purchase Details
Closed on
Jan 1, 2002
Create a Home Valuation Report for This Property
The Home Valuation Report is an in-depth analysis detailing your home's value as well as a comparison with similar homes in the area
Home Values in the Area
Average Home Value in this Area
Purchase History
| Date | Buyer | Sale Price | Title Company |
|---|---|---|---|
| Pham The Nhu | $209,000 | -- | |
| Osborne Joshua T | $157,000 | -- | |
| Us Bank National Association T | $153,000 | -- | |
| Monroe Richard J | $197,000 | -- | |
| Timberwood Homes Inc | $20,300 | -- | |
| -- | $272,000 | -- | |
| -- | $1,197,000 | -- |
Source: Public Records
Mortgage History
| Date | Status | Borrower | Loan Amount |
|---|---|---|---|
| Previous Owner | Us Bank National Association T | $154,913 | |
| Previous Owner | Monroe Richard J | $187,150 |
Source: Public Records
Tax History Compared to Growth
Tax History
| Year | Tax Paid | Tax Assessment Tax Assessment Total Assessment is a certain percentage of the fair market value that is determined by local assessors to be the total taxable value of land and additions on the property. | Land | Improvement |
|---|---|---|---|---|
| 2024 | $1,633 | $122,208 | $16,000 | $106,208 |
| 2023 | $1,535 | $107,174 | $16,000 | $91,174 |
| 2022 | $1,456 | $98,867 | $16,000 | $82,867 |
| 2021 | $1,514 | $87,701 | $12,000 | $75,701 |
| 2020 | $1,530 | $78,986 | $10,000 | $68,986 |
| 2019 | $1,460 | $74,712 | $8,000 | $66,712 |
| 2018 | $1,468 | $74,252 | $8,000 | $66,252 |
| 2017 | $1,463 | $73,575 | $8,000 | $65,575 |
| 2016 | $1,500 | $73,124 | $8,000 | $65,124 |
| 2015 | $1,436 | $73,773 | $10,000 | $63,773 |
| 2014 | $1,585 | $79,822 | $12,000 | $67,822 |
| 2013 | -- | $80,559 | $12,000 | $68,559 |
Source: Public Records
Map
Nearby Homes
- 120 Providence Point Ln
- 339 Lightwood Ln
- 0 Pineywoods Rd Unit 10551989
- 36 Crest Dr Unit Lot 23
- 40 Crest Dr Unit 24
- 370 Paradise Point Rd
- 425 Wyndward Point Dr
- 2580 Ridge Rd
- 2209 Ridge Rd
- 47 Rabbit Run
- 103 Joy Ln Unit LAKE HARTWELL DUPLEX
- 101 AND 103 Joy Ln Unit DUPLEX ON LAKE HARTW
- 138 Grandview Ct
- 136 Grandview Ct
- 85 Majestic Shores Trail
- LOT E Majestic Shores Rd
- LOT 25 Majestic Shores Rd
- LOT 23 Majestic Shores Rd
- LOT 13 Majestic Shores Rd
- LOT 12 Majestic Shores Rd
- 184 Providence Point Ln
- 204 Providence Point Ln
- 164 Providence Point Unit 11
- 164 Providence Point Ln
- 181 Providence Point Ln
- 100 Providence Point Ln
- 213 Providence Point Ln
- 143 Masseys Subdivision Rd
- 159 Masseys Subdivision Rd
- 0 Massey Subdivision Rd Unit 3142085
- 0 Massey Subdivision Rd Unit B 7441728
- 82 Providence Point Ln
- Lot 15 Providence Pointe Ln
- Lot 22 Providence Pointe Ln
- Lot 18 Providence Pointe Ln
- Lot 16 Providence Pointe Ln
- Lot 21 Providence Pointe Ln
- 159 Massey Subdivision Rd
- 212 Providence Pointe Ln
- 201 Providence Point Ln