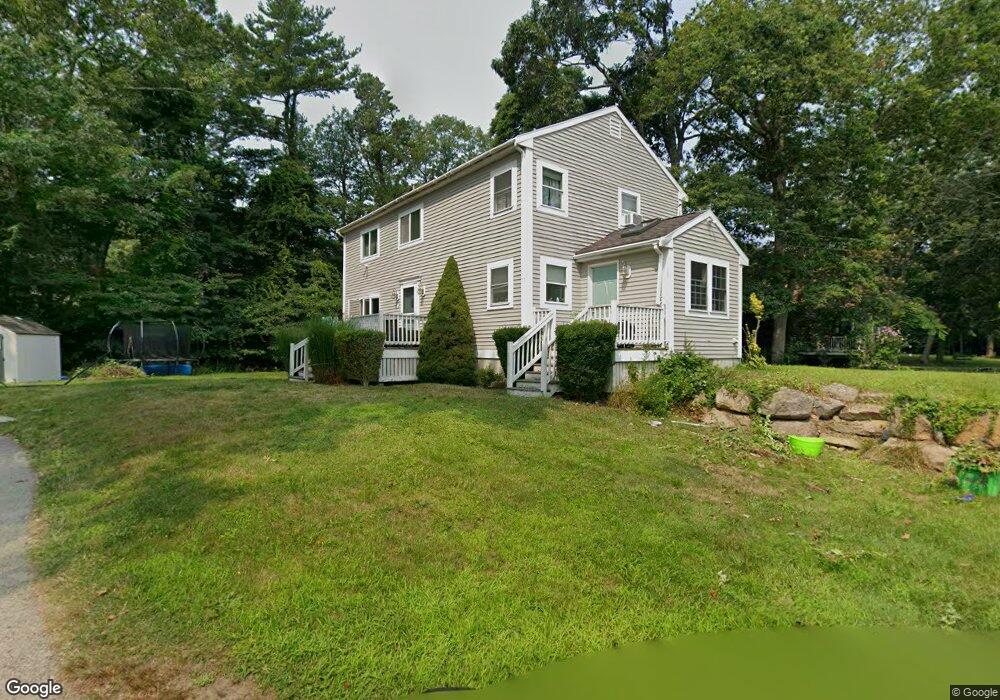
184 Quincy Ave Marshfield, MA 02050
Estimated Value: $712,000 - $802,000
3
Beds
2
Baths
1,771
Sq Ft
$426/Sq Ft
Est. Value
About This Home
This home is located at 184 Quincy Ave, Marshfield, MA 02050 and is currently estimated at $754,130, approximately $425 per square foot. 184 Quincy Ave is a home located in Plymouth County with nearby schools including South River, Furnace Brook Middle School, and Marshfield High School.
Ownership History
Date
Name
Owned For
Owner Type
Purchase Details
Closed on
Aug 10, 2011
Sold by
Mcdonough Matthew W and Mcdonough Rebecca
Bought by
Mrobicheau Donald and Mrobicheau Ann M
Current Estimated Value
Home Financials for this Owner
Home Financials are based on the most recent Mortgage that was taken out on this home.
Original Mortgage
$323,583
Outstanding Balance
$220,674
Interest Rate
4.25%
Mortgage Type
FHA
Estimated Equity
$533,456
Purchase Details
Closed on
Aug 22, 2008
Sold by
Mcdonough Matthew W
Bought by
Mcdonough Matthew W and Mcdonough Rebecca
Purchase Details
Closed on
Feb 8, 2007
Sold by
Flipp David A and Pimen Catherine L
Bought by
Wells Fargo Bank Na
Purchase Details
Closed on
Jan 22, 2004
Sold by
Flipp David
Bought by
Flipp David and Pimental Catherine L
Create a Home Valuation Report for This Property
The Home Valuation Report is an in-depth analysis detailing your home's value as well as a comparison with similar homes in the area
Home Values in the Area
Average Home Value in this Area
Purchase History
| Date | Buyer | Sale Price | Title Company |
|---|---|---|---|
| Mrobicheau Donald | $332,000 | -- | |
| Mcdonough Matthew W | -- | -- | |
| Mcdonough Matthew W | $321,000 | -- | |
| Wells Fargo Bank Na | $291,357 | -- | |
| Flipp David | -- | -- |
Source: Public Records
Mortgage History
| Date | Status | Borrower | Loan Amount |
|---|---|---|---|
| Open | Mrobicheau Donald | $323,583 | |
| Previous Owner | Flipp David | $319,990 |
Source: Public Records
Tax History Compared to Growth
Tax History
| Year | Tax Paid | Tax Assessment Tax Assessment Total Assessment is a certain percentage of the fair market value that is determined by local assessors to be the total taxable value of land and additions on the property. | Land | Improvement |
|---|---|---|---|---|
| 2025 | $6,442 | $650,700 | $260,900 | $389,800 |
| 2024 | $6,272 | $603,700 | $250,800 | $352,900 |
| 2023 | $5,965 | $536,500 | $230,800 | $305,700 |
| 2022 | $5,965 | $460,600 | $198,700 | $261,900 |
| 2021 | $5,730 | $434,400 | $198,700 | $235,700 |
| 2020 | $5,328 | $399,700 | $170,600 | $229,100 |
| 2019 | $5,173 | $386,600 | $170,600 | $216,000 |
| 2018 | $5,028 | $376,100 | $164,500 | $211,600 |
| 2017 | $4,884 | $356,000 | $164,500 | $191,500 |
| 2016 | $4,757 | $342,700 | $164,500 | $178,200 |
| 2015 | $4,495 | $338,200 | $164,500 | $173,700 |
| 2014 | $4,423 | $332,800 | $164,500 | $168,300 |
Source: Public Records
Map
Nearby Homes
- 174 Quincy Ave
- 169 Quincy Ave
- 169 Quincy Ave
- 115 Rockport St
- 167 Washington Ave
- LOT 167 Washington Ave
- 160 Quincy Ave
- 165 Quincy Ave
- 146 Dakota St
- 115 Dakota St
- 150 Quincy Ave
- 162 Washington Ave
- 142 Nantasket St
- 155 Dakota St
- 141 Washington Ave
- 149 Nantasket St
- 92 Nantasket St
- 141 Nantasket St
- 147 Nantasket St
- 136 Revere St